All posts

tutorial

8 posts

p5.js Session 8: Push and Pop

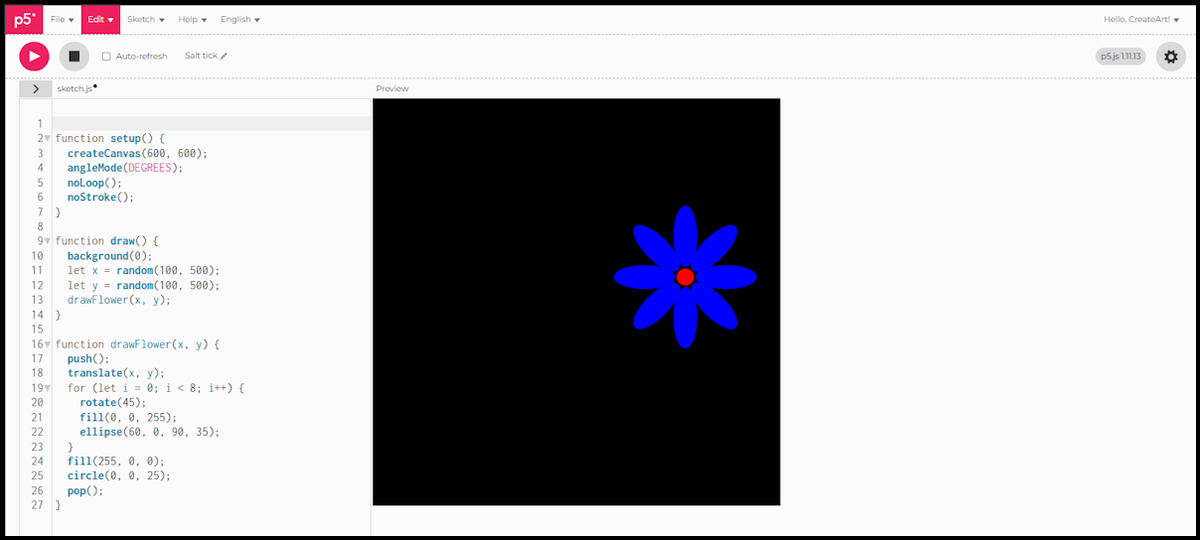
Last session’s flower lived on its own in the centre of the canvas. This time we want four of them, one in each corner. That’s where translate() and rotate() start to show their real behaviour: every change to the canvas carries over into everything drawn after it.

Translating from corner to corner

We want four flowers, one in each corner of the square: 150, 150, then 450, 150, then 450, 450, then 150, 450. The simplest option is to repeat last session’s script four times, changing only the translate() coordinates. Let’s try that and see what actually happens.

function setup() {
  createCanvas(1200, 1200);
  angleMode(DEGREES);
  noLoop();
  noStroke();
}

function draw() {
  background(220);
  fill(0);
  rect(0, 0, 600, 600);

  translate(150, 150);
  for (let i = 0; i < 8; i++) {
    rotate(45);
    fill(0, 0, 255);
    ellipse(60, 0, 90, 35);
  }
  fill(255, 0, 0);
  circle(0, 0, 25);

  translate(450, 150);
  for (let i = 0; i < 8; i++) {
    rotate(45);
    fill(0, 0, 255);
    ellipse(60, 0, 90, 35);
  }
  fill(255, 0, 0);
  circle(0, 0, 25);

  translate(450, 450);
  for (let i = 0; i < 8; i++) {
    rotate(45);
    fill(0, 0, 255);
    ellipse(60, 0, 90, 35);
  }
  fill(255, 0, 0);
  circle(0, 0, 25);

  translate(150, 450);
  for (let i = 0; i < 8; i++) {
    rotate(45);
    fill(0, 0, 255);
    ellipse(60, 0, 90, 35);
  }
  fill(255, 0, 0);
  circle(0, 0, 25);
}

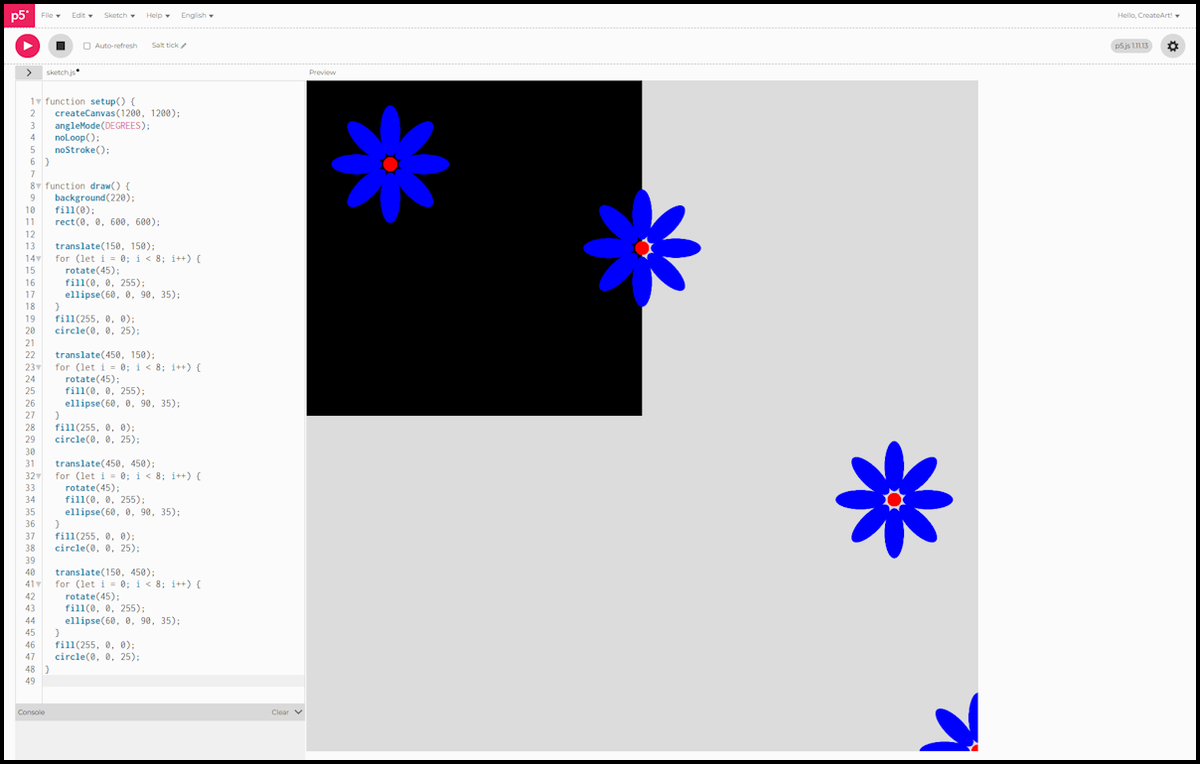
Only the first flower lands where intended, at 150, 150. Each translate() after it moves from wherever the origin already sits, not from the canvas corner. The second call adds 450, 150 onto the first flower’s position and lands at 600, 300; the third and fourth compound further still, and the last flower ends up almost off the canvas. Every translate and rotate call carries the ones before it.

Four flowers meant to sit inside the black square, but each translate() pushes further off course than the last

push() and pop()

push() saves the current drawing state, position, rotation, fill, stroke, like a bookmark. pop() returns to that bookmark. Anything between the two, any translate() or rotate(), is undone the moment pop() runs.

function setup() {
  createCanvas(1200, 1200);
  angleMode(DEGREES);
  noLoop();
  noStroke();
}

function draw() {
  background(220);
  fill(0);
  rect(0, 0, 600, 600);

  push();
  translate(150, 150);
  for (let i = 0; i < 8; i++) {
    rotate(45);
    fill(0, 0, 255);
    ellipse(60, 0, 90, 35);
  }
  fill(255, 0, 0);
  circle(0, 0, 25);
  pop();

  push();
  translate(450, 150);
  for (let i = 0; i < 8; i++) {
    rotate(45);
    fill(0, 0, 255);
    ellipse(60, 0, 90, 35);
  }
  fill(255, 0, 0);
  circle(0, 0, 25);
  pop();

  push();
  translate(450, 450);
  for (let i = 0; i < 8; i++) {
    rotate(45);
    fill(0, 0, 255);
    ellipse(60, 0, 90, 35);
  }
  fill(255, 0, 0);
  circle(0, 0, 25);
  pop();

  push();
  translate(150, 450);
  for (let i = 0; i < 8; i++) {
    rotate(45);
    fill(0, 0, 255);
    ellipse(60, 0, 90, 35);
  }
  fill(255, 0, 0);
  circle(0, 0, 25);
  pop();
}

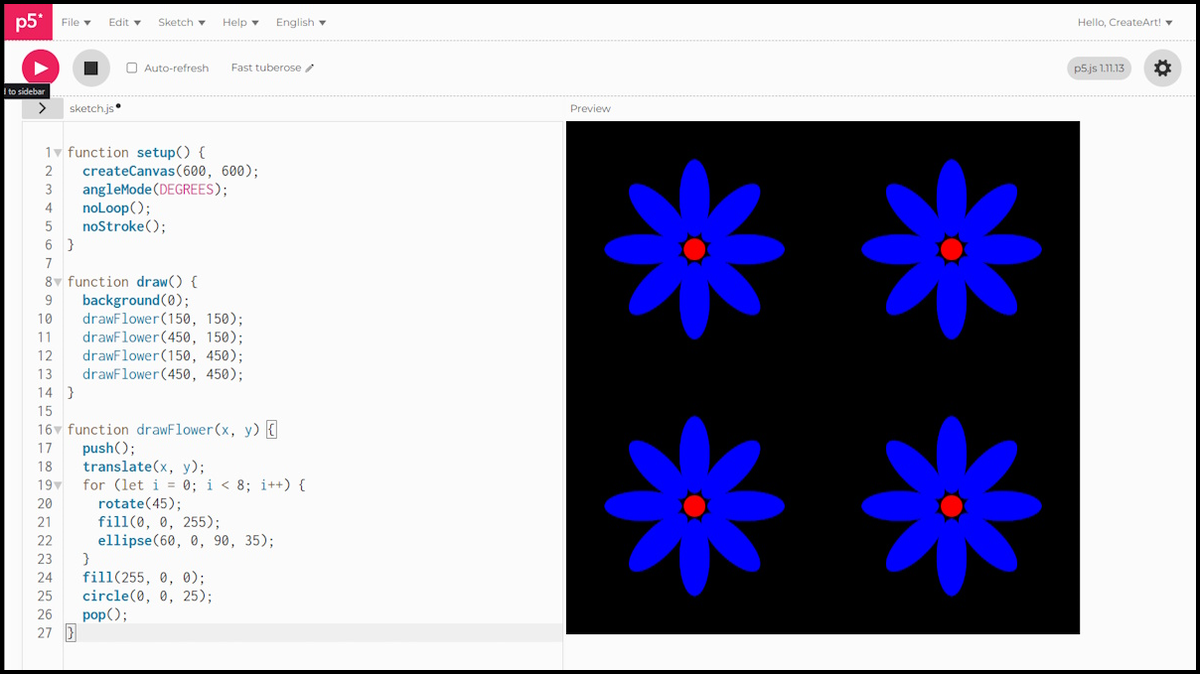
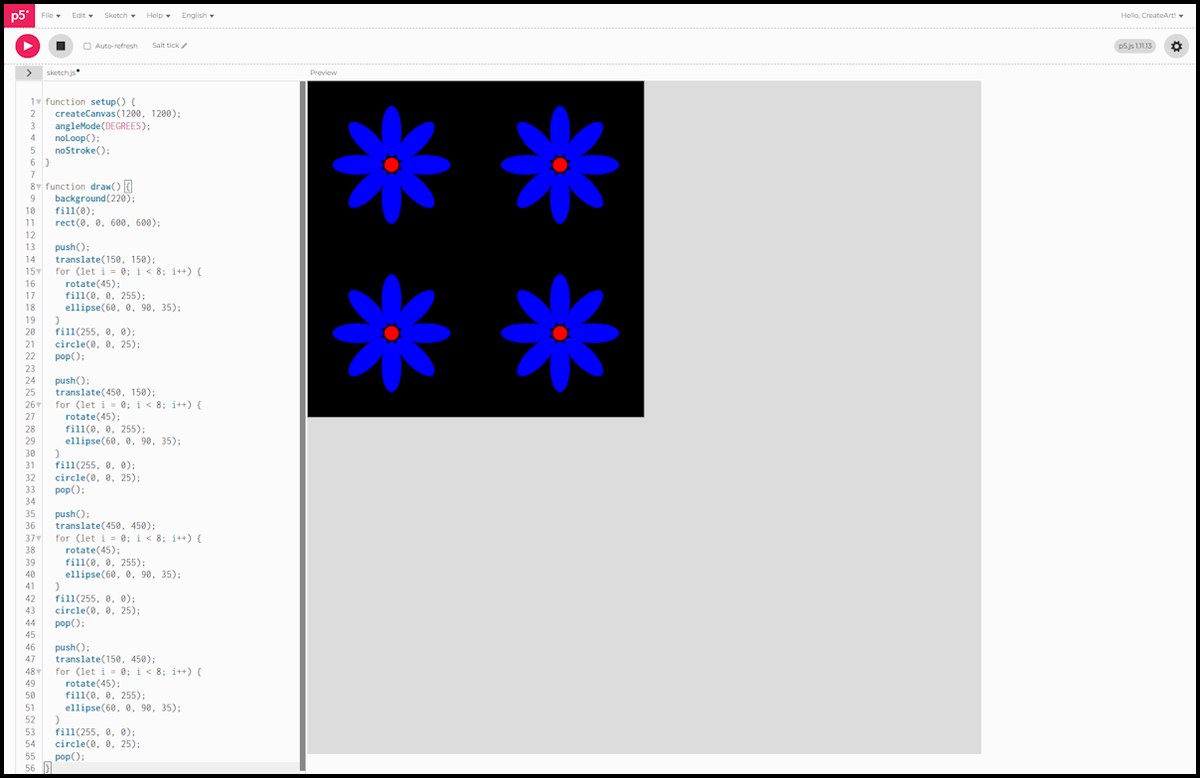
Each push() / pop() pair works in its own bubble. Whatever happens to the canvas inside it gets discarded the moment pop() runs, so the next block starts fresh from the canvas’s real origin. That’s why all four flowers land exactly on their corners this time.
Four flowers, each landing exactly on its corner position inside the black square, thanks to push() and pop()

It works, but look at what we just did: the exact same dozen lines, copied four times, with only the translate coordinates changed.


In Session 9 we fix that: functions let us name this block of code once and call it as often as we like.

p5.js Session 7: Translate and Rotate

Grids gave us control over position. This session is about control over orientation: moving where you draw from, then turning what you draw.

Moving the origin with translate()

let cx;
let cy;

function setup() {
  createCanvas(600, 600);
  noLoop();
  stroke(255, 255, 255);

  cx = width / 2;
  cy = height / 2;
}

function draw() {
  background(0);
  translate(cx, cy);
  ellipse(0, 0, 150, 150);
}
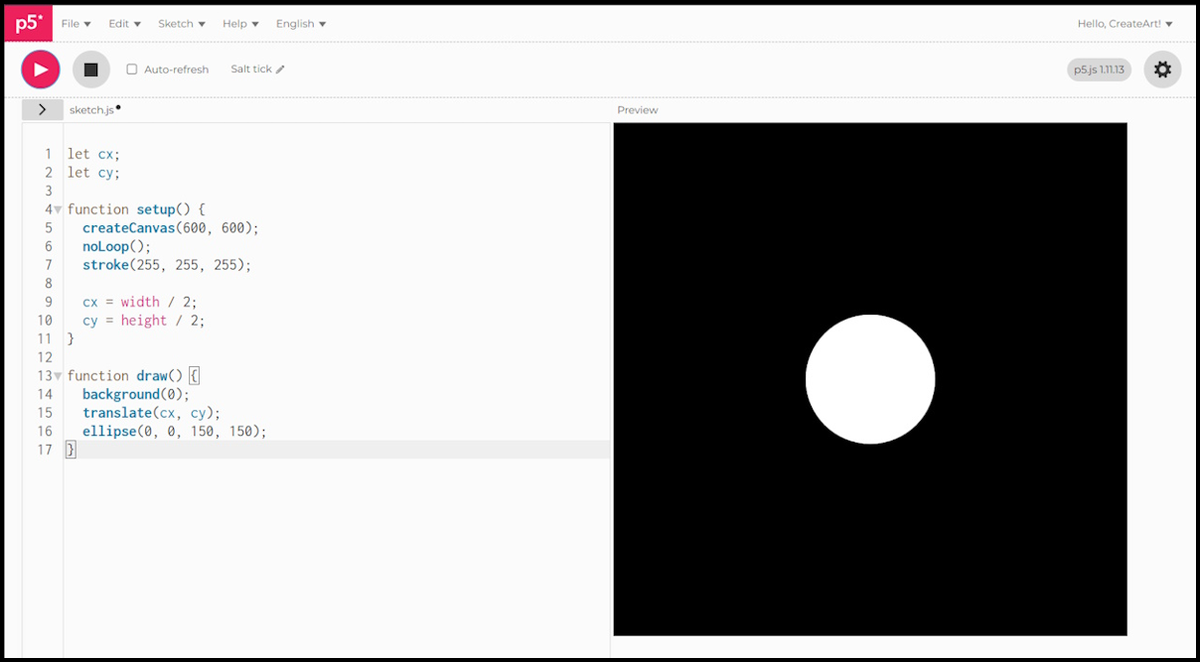
  • cx and cy store the centre point of the canvas, calculated once in setup() so we don’t repeat width / 2 and height / 2 every time we need them.
  • translate(cx, cy) moves the origin there, so ellipse(0, 0, 150, 150) lands dead centre instead of in the top-left corner.

Circle outline drawn at the canvas centre using translate()

Rotating around the origin

let cx;
let cy;

function setup() {
  createCanvas(600, 600);
  angleMode(DEGREES);
  noLoop();
  stroke(255, 255, 255);
  cx = width / 2;
  cy = height / 2;
}

function draw() {
  background(0);
  translate(cx, cy);
  circle(0, 0, 15);
  for (let i = 0; i < 8; i++) {
    rotate(45);
    fill(255, 255, 255);
    rect(100, 0, 60, 60);
    fill(255, 0, 0);
    circle(100, 0, 15);
  }
}
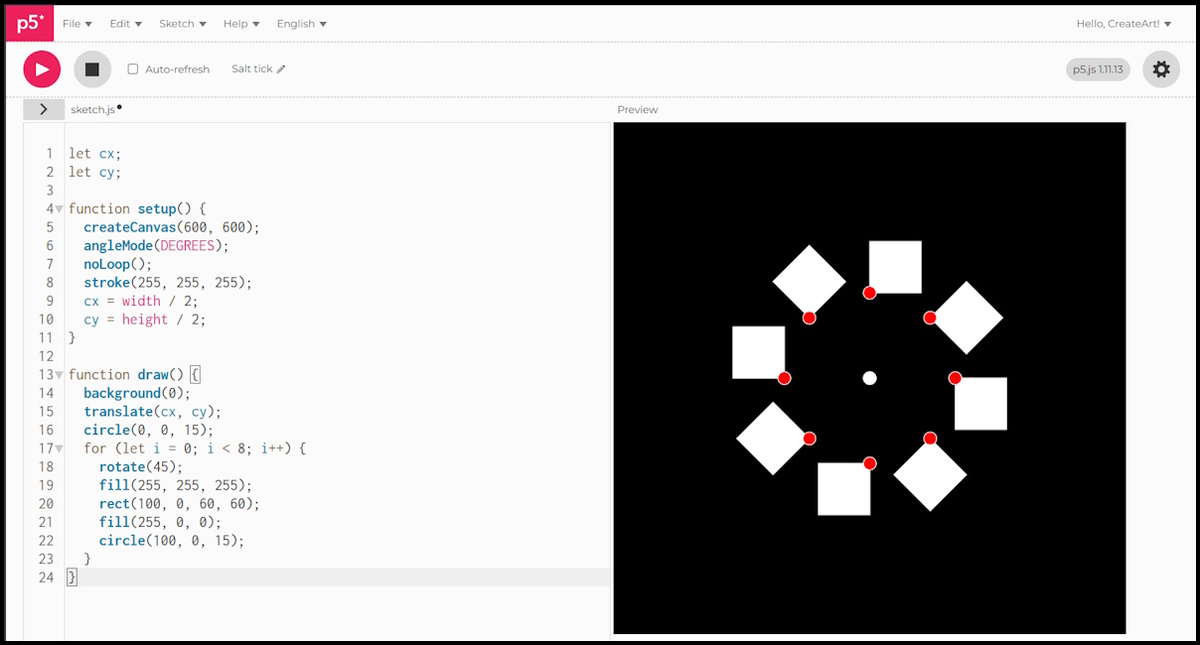
  • angleMode(DEGREES) tells p5.js to read angles in degrees rather than radians.
  • rotate(45) turns the canvas a little further each time round, eight times in total, adding up to a full 360-degree turn.
  • Each square is drawn at the same offset point, (100, 0), but lands somewhere new around the centre because the canvas has already been rotated by a different amount.
  • The small red circle marks that anchor point on each square.
  • The white circle at (0, 0) is just a reference dot showing where the origin sits after translate().

Eight white squares arranged in a ring around the canvas centre, each marked with a red anchor point, rotated using rotate() inside a for loop

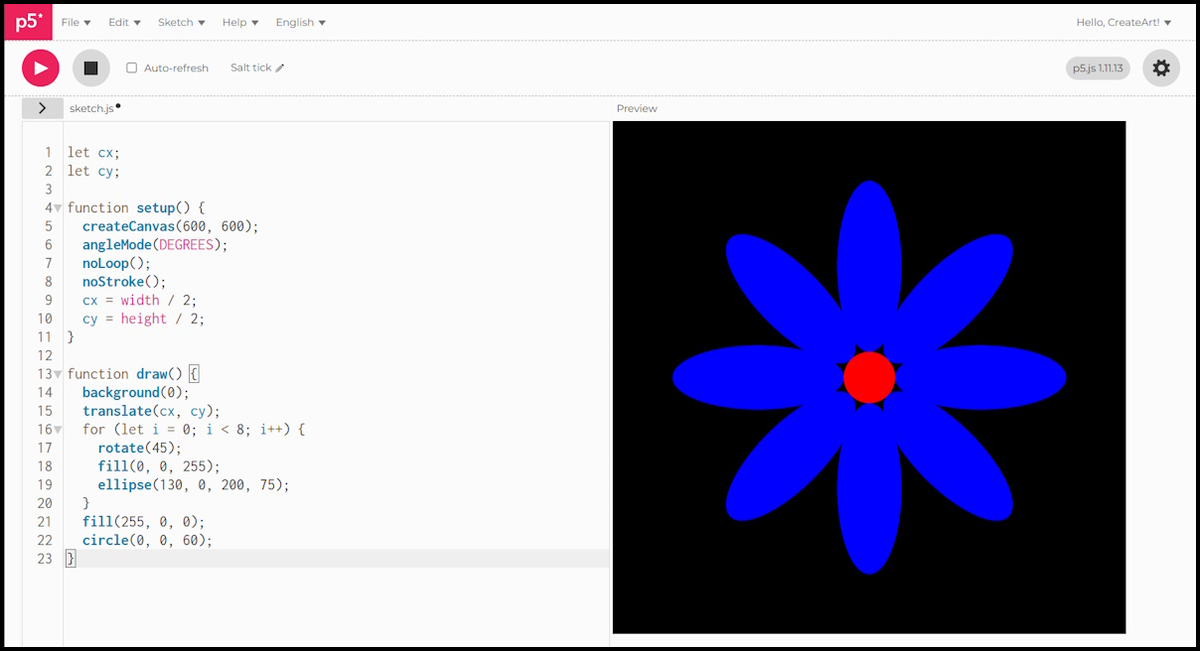
We’ve already got everything we need: a centre point, a loop, and a rotation. From here it’s just a matter of swapping the shapes for something that reads as petals instead of squares.

Building the flower

let cx;
let cy;

function setup() {
  createCanvas(600, 600);
  angleMode(DEGREES);
  noLoop();
  noStroke();
  cx = width / 2;
  cy = height / 2;
}

function draw() {
  background(0);
  translate(cx, cy);
  for (let i = 0; i < 8; i++) {
    rotate(45);
    fill(0, 0, 255);
    ellipse(130, 0, 200, 75);
  }
  fill(255, 0, 0);
  circle(0, 0, 60);
}

Same loop and rotation as before, but the squares are gone. Each turn of the loop draws a wide, flattened blue ellipse offset from the centre, which reads as a petal once there are eight of them overlapping around a point. The red circle goes last, sitting on top in the middle as the flower’s core.

Finished flower sketch: eight blue ellipse petals rotated around a centre, with a red circle at the middle


In Session 8 we look at push() and pop(): saving and restoring the canvas position.

p5.js Session 6: Conditions

In Session 4 we built a grid where every cell looked exactly the same. That uniformity is useful, but it is also a little rigid. In this session we use conditions to make choices, so different cells can look different depending on a rule we define.

What an if statement does

Think about a traffic light. It does not show all three colours at once. It looks at the current state and picks one. An if statement works the same way: it checks whether something is true, and only runs its code if it is.

if (i % 2 === 0) {
  fill(200, 50, 50);
}

% is the remainder operator. i % 2 gives you the remainder when i is divided by 2. When i is 0, 2, or 4 the remainder is 0, so the condition is true and the fill turns red. When i is 1, 3, or 5 the remainder is 1, the condition is false, and the fill is not changed.

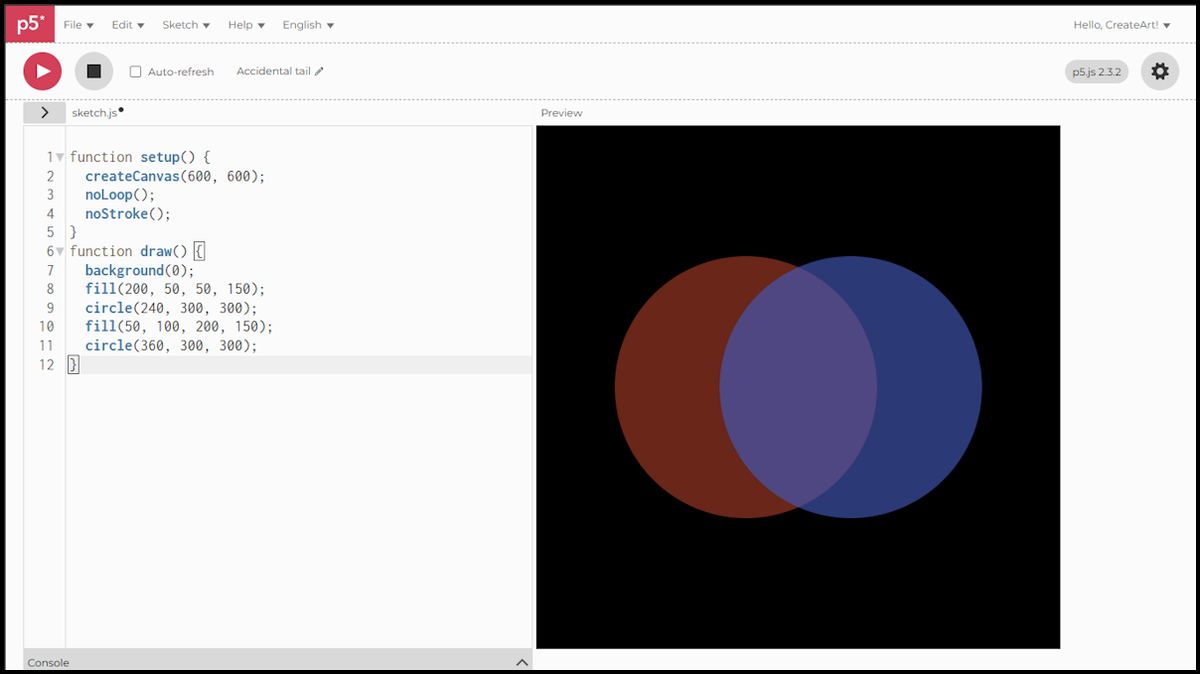
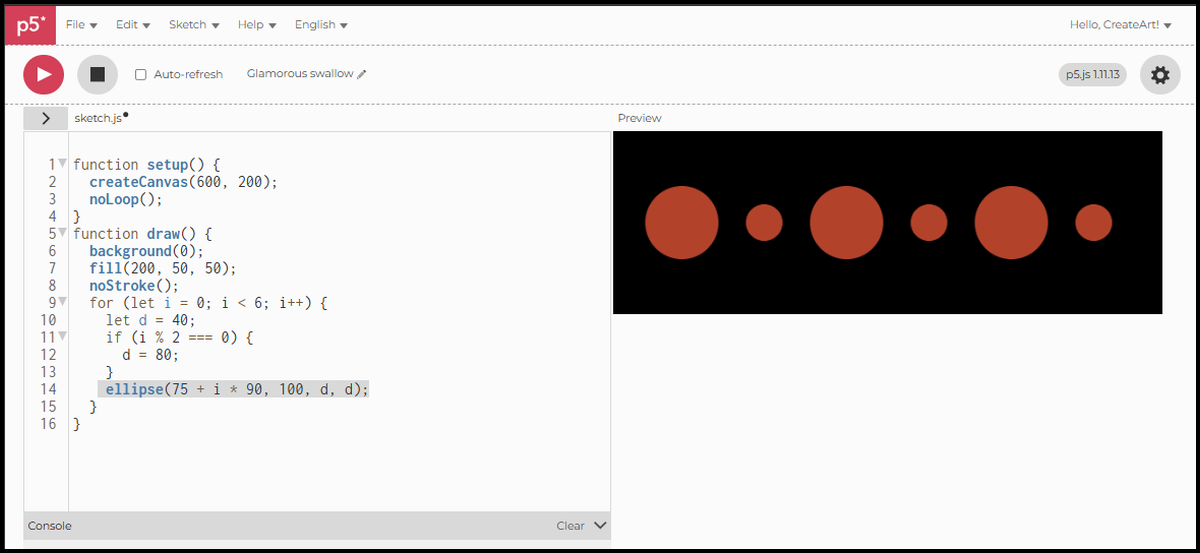
Here is a row of circles using that condition. Every circle starts at size 40. The if makes every other one larger. When the condition is false, nothing changes.

function setup() {
  createCanvas(600, 200);
  noLoop();
}
function draw() {
  background(0);
  fill(200, 50, 50);
  noStroke();
  for (let i = 0; i < 6; i++) {
    let d = 40;
    if (i % 2 === 0) {
      d = 80;
    }
    ellipse(75 + i * 90, 100, d, d);
  }
}
// what each line does inside the loop:
// let d = 40             <- start with a default diameter every time
// if (i % 2 === 0)       <- check: is this an even position?
//   d = 80               <- yes: override the diameter
//                        <- no: d stays at 40, nothing else happens
// ellipse(...)           <- draws using whichever d was set

Row of 6 circles alternating between large and small on a black canvas

The if / else statement

A plain if only acts when the condition is true, and does nothing when it is false. if / else covers both cases explicitly: one outcome when the condition is true, a different one when it is not.

function setup() {
  createCanvas(600, 200);
  rectMode(CENTER);
  noLoop();
}
function draw() {
  background(0);
  noStroke();
  for (let i = 0; i < 6; i++) {
    if (i % 2 === 0) {     // even position
      fill(200, 50, 50);   // red
      rect(75 + i * 90, 100, 60, 60);
    } else {               // odd position
      fill(50, 100, 200);  // blue
      ellipse(75 + i * 90, 100, 60, 60);
    }
  }
}
// what each line does inside the loop:
// if (i % 2 === 0)        <- check: is this an even position?
//   fill(200, 50, 50)     <- yes: red fill
//   rect(...)             <- and draw a square
// else                    <- no, it must be odd
//   fill(50, 100, 200)    <- blue fill
//   ellipse(...)          <- and draw a circle

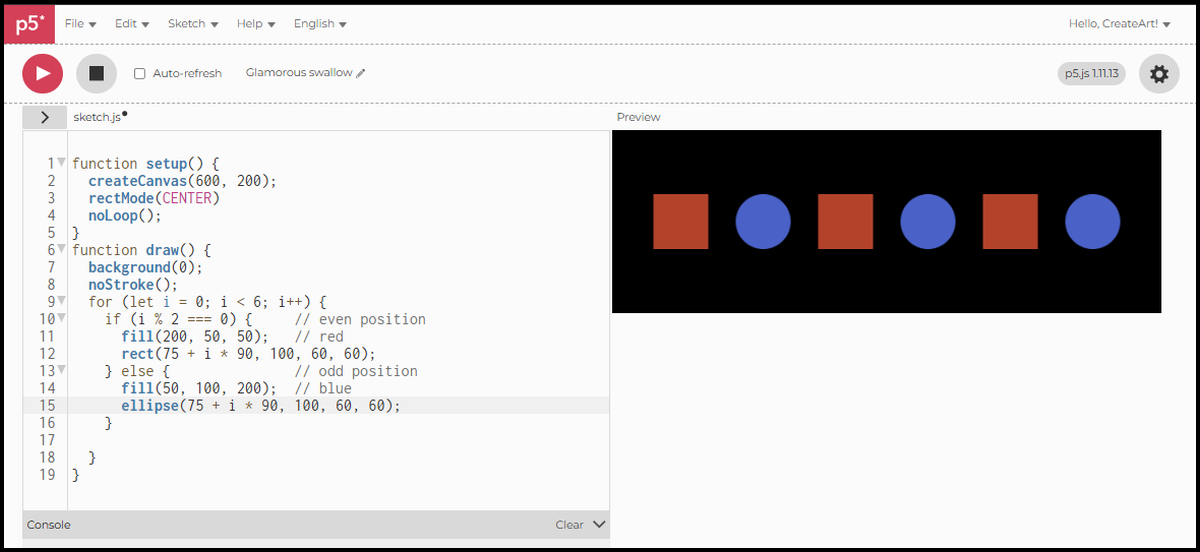
Every shape is handled by one branch or the other. Not just the colour changes — the shape itself changes. Each branch is completely independent.

Row alternating red squares and blue circles on a black canvas

The if / else if / else statement

Two outcomes cover a lot, but sometimes you need more. else if lets you chain conditions. The sketch checks each one in order and runs the first branch that is true. If none match, else catches everything else.

function setup() {
  createCanvas(600, 200);
  noLoop();
}
function draw() {
  background(0);
  noStroke();
  for (let i = 0; i < 6; i++) {
    if (i % 3 === 0) {
      fill(200, 50, 50);
    } else if (i % 3 === 1) {
      fill(255);
    } else {
      fill(50, 100, 200);
    }
    ellipse(50 + i * 90, 100, 60, 60);
  }
}
// what each line does inside the loop:
// if (i % 3 === 0)        <- check: is the remainder 0? (i = 0, 3)
//   fill(200, 50, 50)     <- yes: red
// else if (i % 3 === 1)   <- no. check again: is the remainder 1? (i = 1, 4)
//   fill(255)             <- yes: white
// else                    <- remainder must be 2 (i = 2, 5)
//   fill(50, 100, 200)    <- blue
// ellipse(...)            <- draw using whichever fill was set

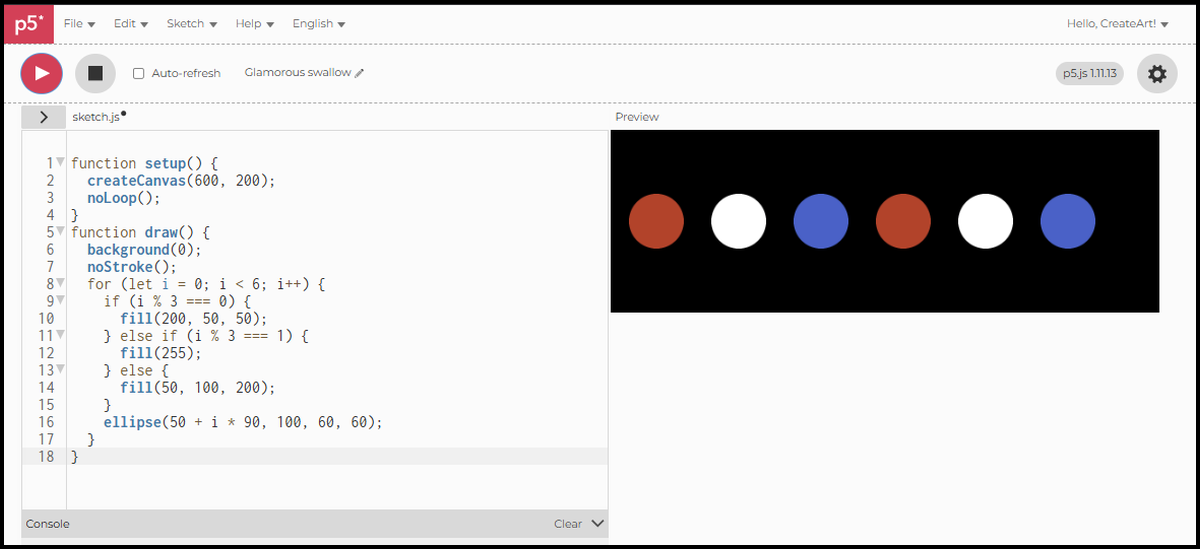
i % 3 cycles through 0, 1, and 2. The six circles get three colours in sequence, repeating twice across the row.

Row of 6 circles cycling through red, white, and blue on a black canvas

Into the grid

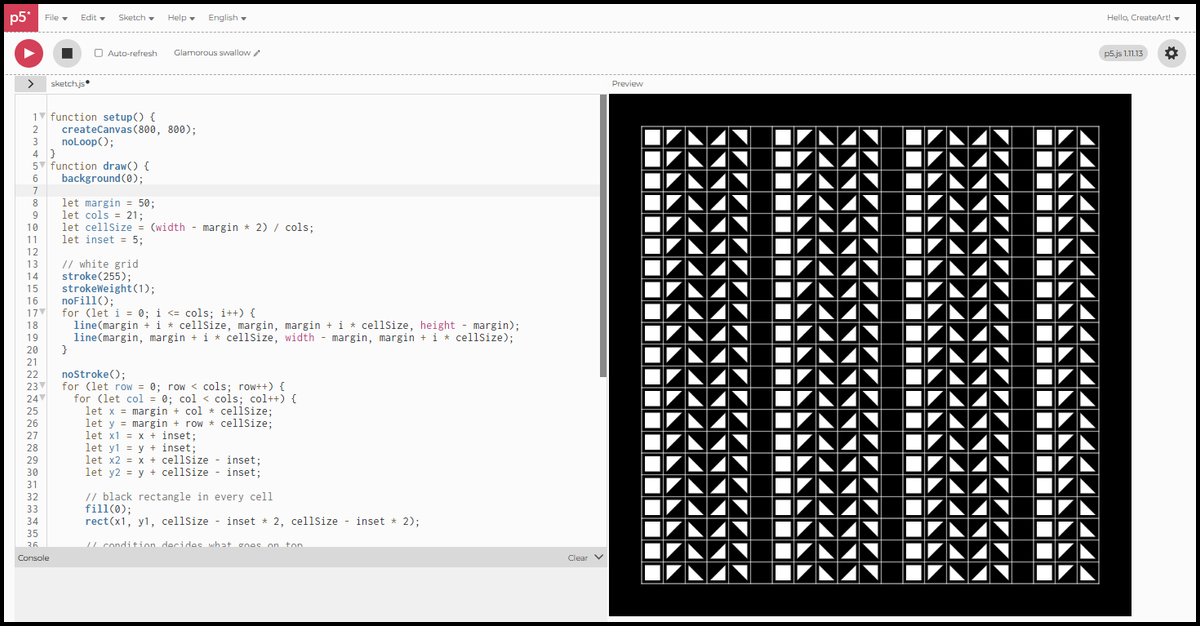
Now take all three forms of condition into a larger grid. This is a 21x21 grid on an 800x800 canvas with 50 pixels of margin on every side. Each cell starts with a black rectangle inset 5 pixels from the grid lines. A condition then decides what goes on top — six outcomes, black and white only.

function setup() {
  createCanvas(800, 800);
  noLoop();
}
function draw() {
  background(0);

  let margin = 50;
  let cols = 21;
  let cellSize = (width - margin * 2) / cols;
  let inset = 5;

  // white grid
  stroke(255);
  strokeWeight(1);
  noFill();
  for (let i = 0; i <= cols; i++) {
    line(margin + i * cellSize, margin, margin + i * cellSize, height - margin);
    line(margin, margin + i * cellSize, width - margin, margin + i * cellSize);
  }

  noStroke();
  for (let row = 0; row < cols; row++) {
    for (let col = 0; col < cols; col++) {
      let x = margin + col * cellSize;
      let y = margin + row * cellSize;
      let x1 = x + inset;
      let y1 = y + inset;
      let x2 = x + cellSize - inset;
      let y2 = y + cellSize - inset;

      // black rectangle in every cell
      fill(0);
      rect(x1, y1, cellSize - inset * 2, cellSize - inset * 2);

      // condition decides what goes on top
      let c = col % 6;
      if (c === 0) {
        fill(255);
        rect(x1, y1, cellSize - inset * 2, cellSize - inset * 2);  // full white
      } else if (c === 1) {
        fill(255);
        triangle(x1, y1, x2, y1, x1, y2);   // top-left triangle
      } else if (c === 2) {
        fill(255);
        triangle(x1, y1, x1, y2, x2, y2);   // bottom-left triangle
      } else if (c === 3) {
        fill(255);
        triangle(x2, y1, x1, y2, x2, y2);   // bottom-right triangle
      } else if (c === 4) {
        fill(255);
        triangle(x1, y1, x2, y1, x2, y2);   // top-right triangle
      }
      // c === 5: full black, nothing added
    }
  }
}
// inside the nested loop:
// x1, y1               <- top-left corner of the inset area
// x2, y2               <- bottom-right corner of the inset area
// fill(0) + rect        <- black rectangle, drawn in every cell
// let c = col % 6       <- cycles through 0, 1, 2, 3, 4, 5 across columns
// if c === 0            <- full white: white rect covers the black one
// if c === 1            <- white triangle in the top-left corner
// if c === 2            <- white triangle in the bottom-left corner
// if c === 3            <- white triangle in the bottom-right corner
// if c === 4            <- white triangle in the top-right corner
// c === 5               <- full black: nothing added, black rect stays

col % 6 cycles through six values. With 21 columns, the pattern repeats three full times across the grid, with the first three outcomes appearing once more in the final columns. The grid runs the same nested loop from Session 4. The only new ingredient is the condition that decides what each cell contains.

21x21 grid in black and white, cells showing full white, corner triangles, and full black based on column


In Session 7 we look at translate() and rotate(): translate() changes where you draw from, rotate() turns the canvas itself, and together they build a flower from rotated petals.

p5.js Session 5: While Loops

In Session 4 the for loop knew in advance how many times to run. Sometimes you don’t know. You just want to keep going until something stops you.

The while loop

Think of filling a shelf with books. You don’t count them in advance. You pick one up from the pile, check whether there’s space, place it on the shelf, and repeat. The moment the shelf is full, you stop.

A while loop works the same way. It checks a condition before each run. If the condition is true, it runs. If it is false, it stops.

function setup() {
  createCanvas(400, 400);
  noLoop();
}
function draw() {
  background(0);
  fill(200, 50, 50);
  noStroke();
  let x = 50;
  while (x < width) {
    ellipse(x, 200, 40, 40);
    x += 70;
  }
}

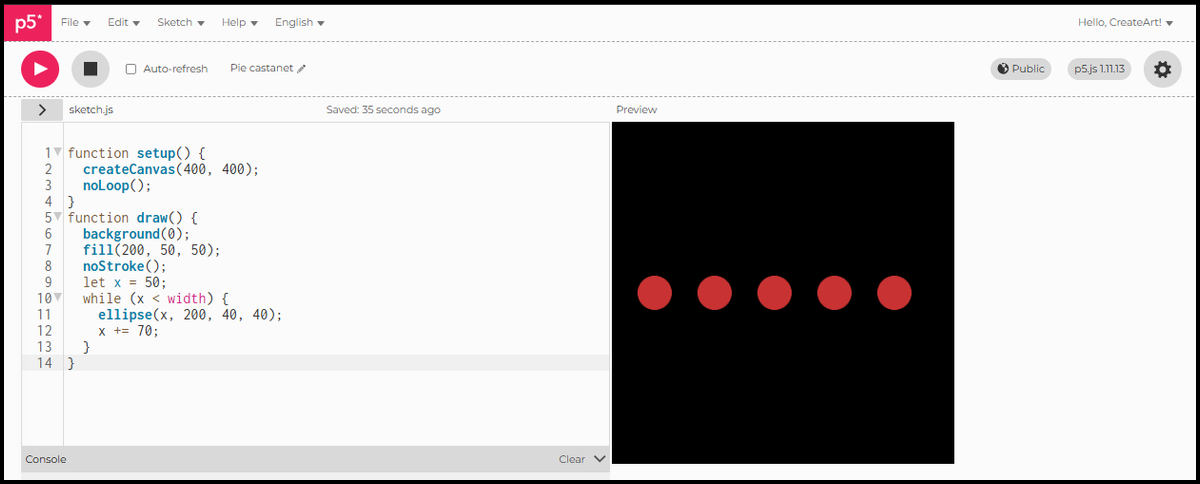
x starts at 50. After each circle, x increases by 70. The loop keeps going as long as x is less than the canvas width. When x reaches or passes 400, the condition is false and the loop stops. How many circles? p5.js works it out at runtime. You just described when to stop.

Red circles in a row on a black canvas

Shrinking rectangles

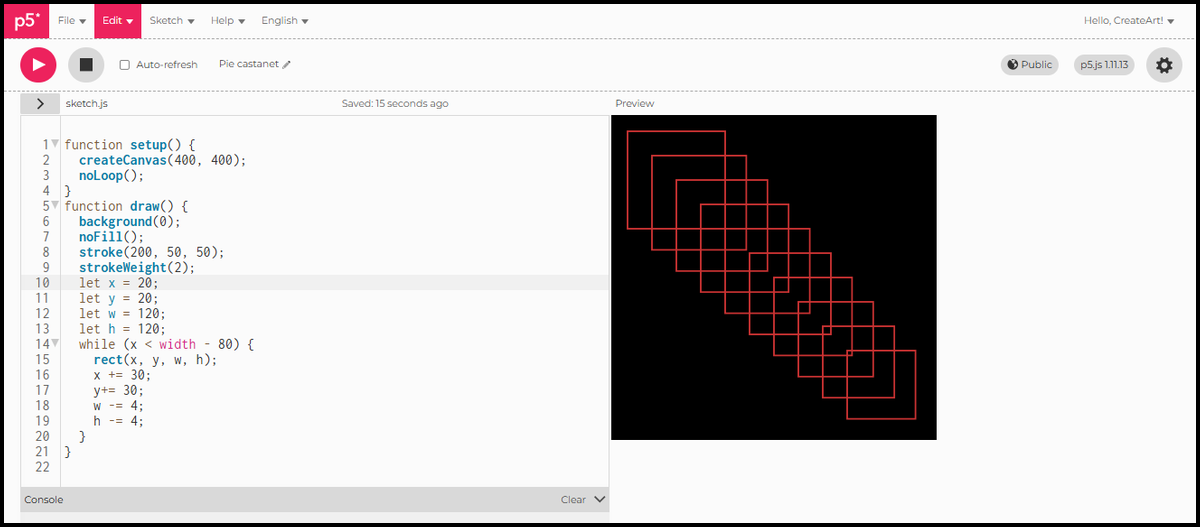
A while loop becomes more interesting when multiple things change with each step. Here four variables update together: x and y move the starting corner diagonally, w and h shrink the size. The condition is spatial: stop when x is 80 pixels from the right edge.

function setup() {
  createCanvas(400, 400);
  noLoop();
}
function draw() {
  background(0);
  noFill();
  stroke(200, 50, 50);
  strokeWeight(2);
  let x = 20;
  let y = 20;
  let w = 120;
  let h = 120;
  while (x < width - 80) {
    rect(x, y, w, h);
    x += 30;
    y += 30;
    w -= 4;
    h -= 4;
  }
}

Each rectangle steps 30 pixels down and to the right, and shrinks by 4 pixels on each side. No fill, just an outline: every rectangle layers over the last, and the overlapping edges create a staircase pattern across the canvas. Four things changing at once, one condition controlling when it stops.

Red outlined rectangles stepping diagonally across a black canvas, each smaller than the last

Infinite loops

Every while loop needs something inside it that eventually makes the condition false. In the example above, x += 30 is that thing. Without it, x never changes, the condition stays true, and the sketch freezes. p5.js stops responding and you have to reload the page. Before running any while loop, check that the update is there.


In Session 6 we look at conditions: how to make different things happen in different parts of the canvas.

p5.js Session 4: Loops and Grids

In Session 3 we placed each shape manually, one line of code at a time. A loop lets you describe a shape once and repeat it as many times as you want.

The for loop

Think of stamping a shape along a line. You pick it up, press it down, move it along, and repeat. A for loop does exactly that in code.

for (let i = 0; i < 5; i++) {
  // this runs 5 times
}

Three parts, separated by semicolons. let i = 0 sets the starting point. i < 5 is the condition: keep going as long as it is true. i++ increases i by 1 after each run. When i reaches 5 the condition is false and the loop stops.

function setup() {
  createCanvas(600, 400);
  noLoop();
}
function draw() {
  background(0);
  fill(200, 50, 50);
  noStroke();
  for (let i = 0; i < 6; i++) {
    ellipse(100 + i * 75, 200, 40, 40);
  }
}

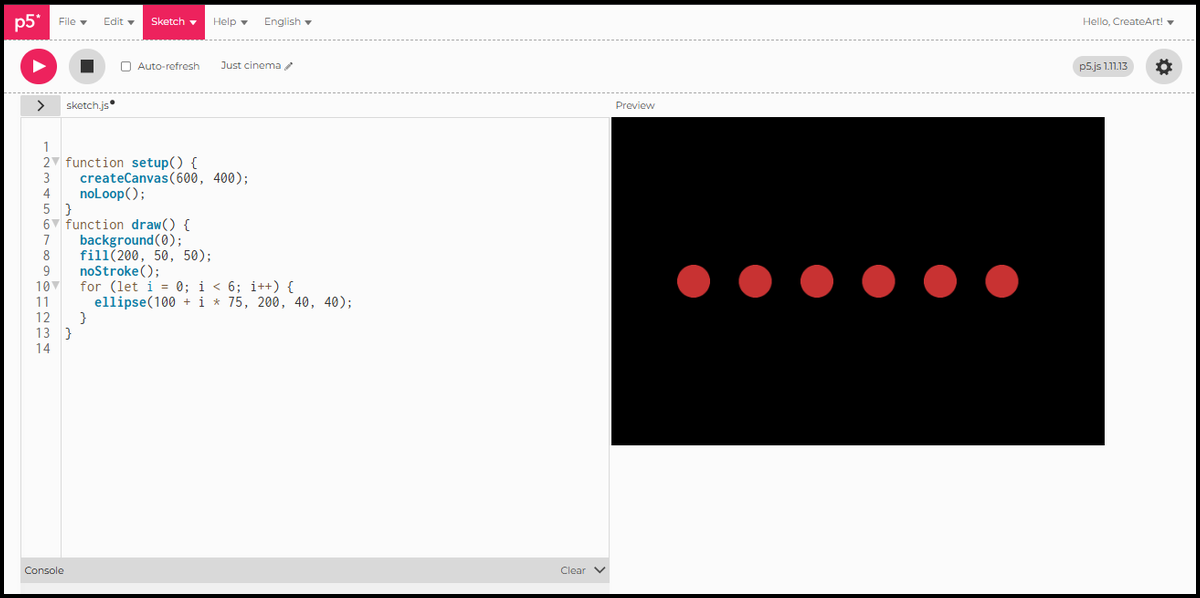
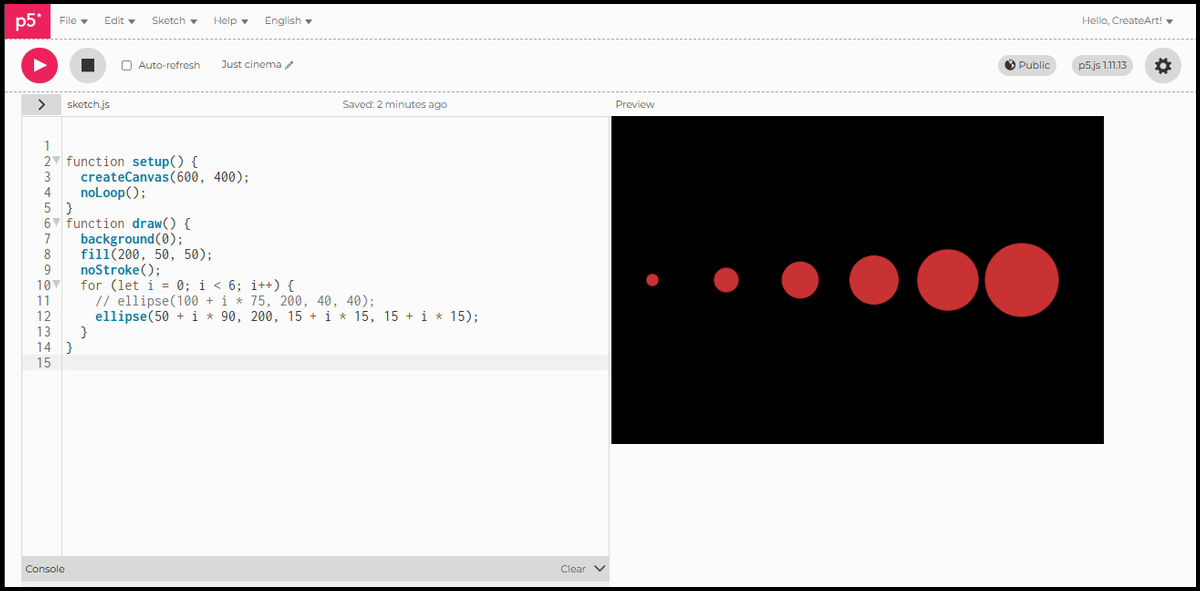
Six equal circles, evenly spaced across a black canvas. Each one is placed at 100 + i * 75: when i is 0 that is 100, when i is 1 that is 175, and so on.

Six equal red circles evenly spaced in a row on a black canvas

i is not just a counter. It is a variable, and you can use it to change any property of the shape. Here it drives the size: each circle is 15 pixels wider than the last.

function setup() {
  createCanvas(600, 400);
  noLoop();
}
function draw() {
  background(0);
  fill(200, 50, 50);
  noStroke();
  for (let i = 0; i < 6; i++) {
    ellipse(50 + i * 90, 200, 15 + i * 15, 15 + i * 15);
  }
}

When i is 0 the diameter is 15. When i is 5 the diameter is 90. The same variable controls where each circle sits and how large it is.

Six red circles in a row growing from small on the left to large on the right

Once you are comfortable with a single loop, you can combine shapes inside it to build more complex patterns. The loop still runs the same way. Everything inside repeats for each value of i.

function setup() {
  createCanvas(600, 400);
  noLoop();
}
function draw() {
  background(0);
  strokeWeight(6);
  for (let i = 0; i < 5; i++) {
    noFill();
    stroke(200, 50, 50);
    ellipse(110 + i * 95, 200, 150, 150);

    noStroke();
    fill(200, 50, 50);
    ellipse(110 + i * 95, 160, 30, 30);
    ellipse(110 + i * 95, 195, 25, 25);
    ellipse(110 + i * 95, 225, 20, 20);
    ellipse(110 + i * 95, 250, 15, 15);

    fill(0, 0, 0);
    ellipse(110 + i * 95, 165, 15, 15);
    ellipse(110 + i * 95, 200, 12.5, 12.5);
    ellipse(110 + i * 95, 230, 10, 10);
    ellipse(110 + i * 95, 255, 6, 6);
  }
}

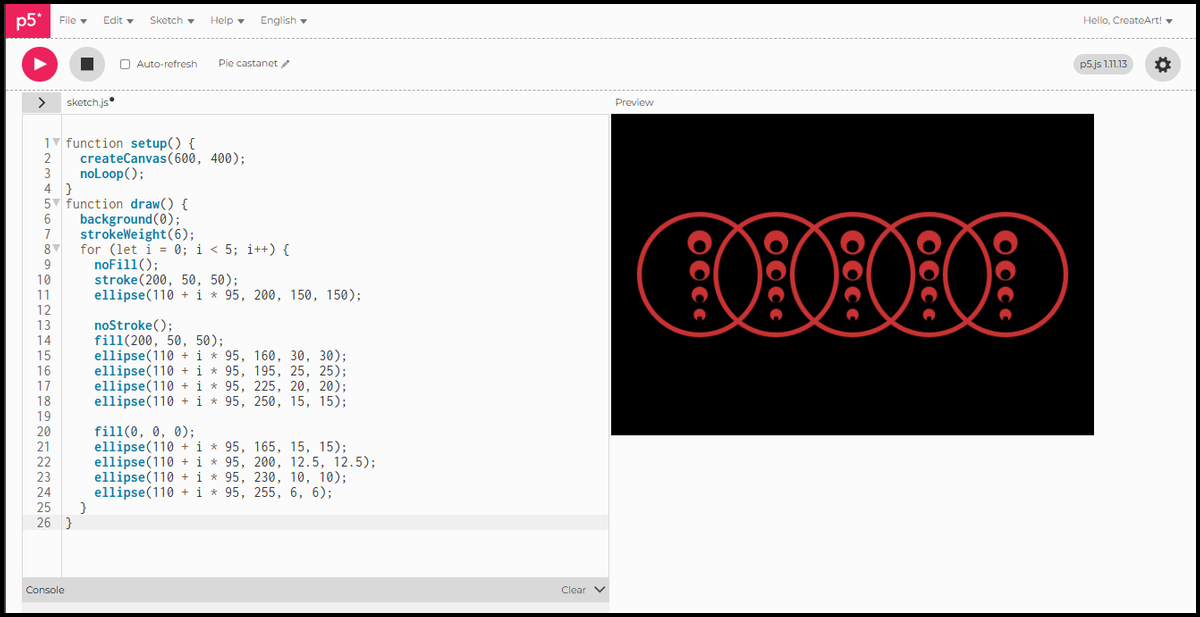
One loop, many shapes per iteration. The single value of i positions everything in the group at once.

Five groups of nested circles on a black canvas, each with a large red outline and a column of smaller red and black circles inside

Nested loops

A single loop repeats something in a line. Two loops nested together repeat it across a grid: the outer loop moves down the rows, the inner loop moves across each column.

function setup() {
  createCanvas(400, 400);
  noLoop();
  rectMode(CENTER);
}
function draw() {
  background(0);
  let cellSize = 80;
  for (let row = 0; row < 5; row++) {
    for (let col = 0; col < 5; col++) {
      let x = 40 + col * cellSize;
      let y = 40 + row * cellSize;
      fill(200, 50, 50);
      noStroke();
      rect(x, y, 60, 60);
      fill(255);
      ellipse(x, y, 40, 40);
      fill(0);
      ellipse(x, y, 20, 20);
    }
  }
}
  • cellSize controls the spacing between cells.
  • x and y are calculated fresh for each cell.
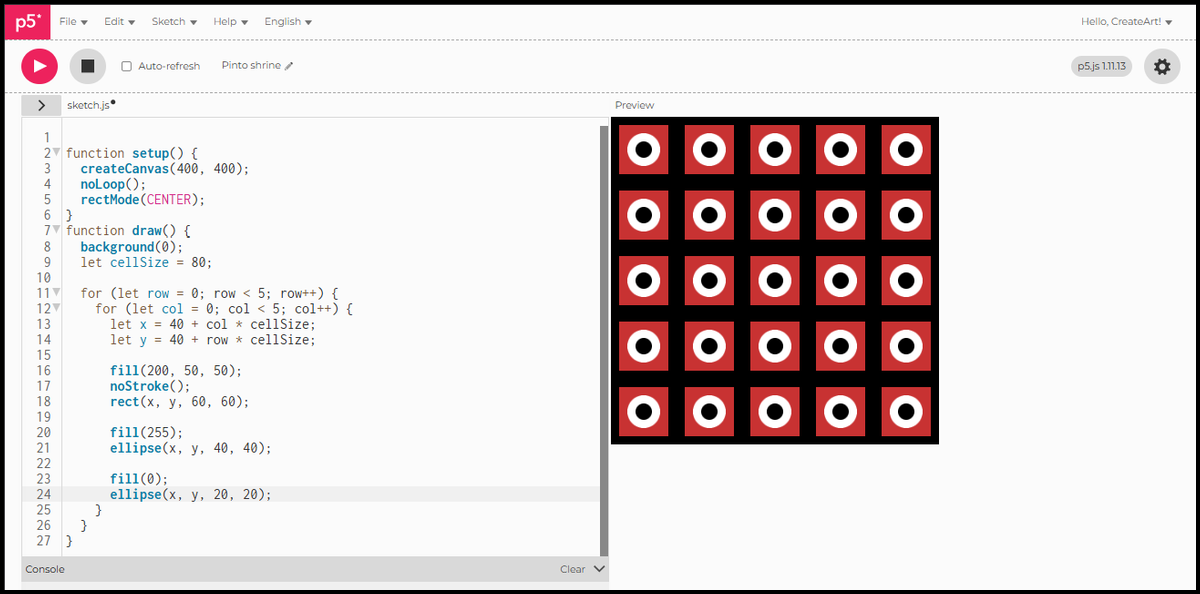
  • Inside each cell: a red square, a white ring, and a black centre, all stacked at the same point using rectMode(CENTER) from Session 3.

Every cell is identical, the grid handles the repetition.

A 5 by 5 grid of red squares each containing a white ring and a black centre

Size variation

The loop variable does not have to control position. Here row drives the size of the black circle: the further down the canvas, the bigger it grows inside its cell.

function setup() {
  createCanvas(400, 400);
  rectMode(CENTER);
  noLoop();
}
function draw() {
  background(0);
  let spacing = 80;
  for (let row = 0; row < 5; row++) {
    for (let col = 0; col < 5; col++) {
      let x = 40 + col * spacing;
      let y = 40 + row * spacing;
      let sizeA = 10 + row * 12;
      fill(200, 50, 50);
      noStroke();
      rect(x, y, 70, 70);
      fill(0, 0, 0);
      noStroke();
      ellipse(x, y, sizeA, sizeA);
    }
  }
}

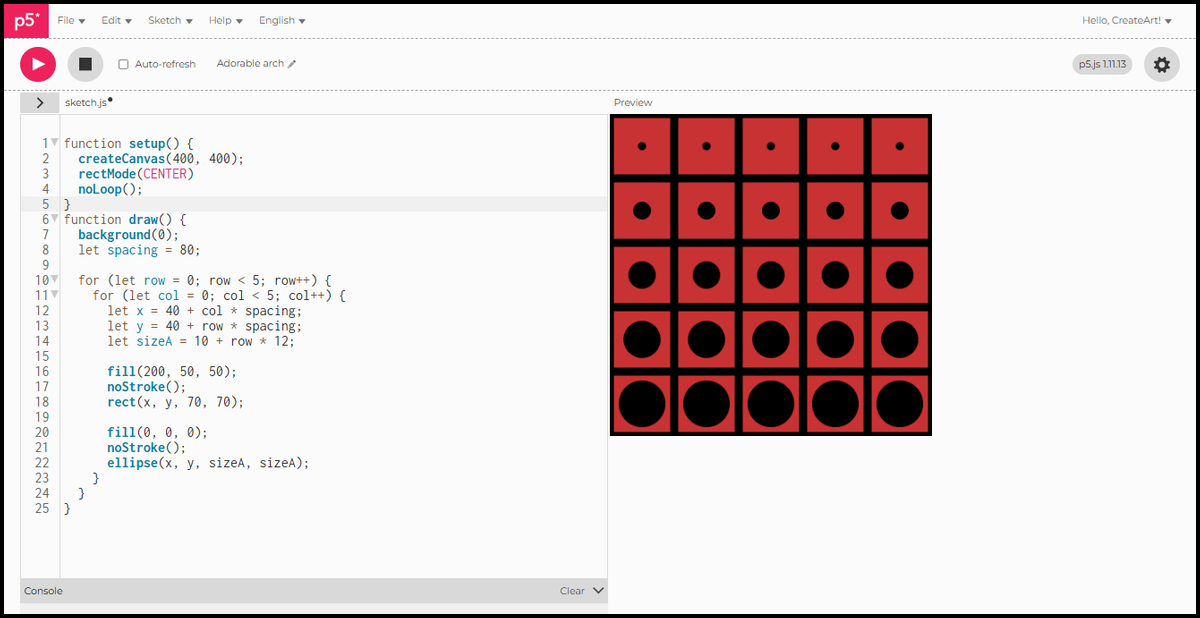
The top row has circles barely visible. By the bottom row they nearly fill the cell. Every cell in the same row is identical. One variable, sizeA, drives the whole variation across the grid.

A 5 by 5 grid of red squares with black circles that grow larger from the top row to the bottom row


In Session 5 we look at while loops: a different way to repeat, useful when you do not know in advance how many times something should run.

p5.js Session 3: More Shapes

The Japan flag needed just one shape. This session we draw another flag, and for that we will add three more shapes to your toolkit.

The rect() function

rect(x, y, width, height) draws a rectangle. By default, x and y are the top-left corner. Width and height set how far it stretches from there.

function setup() {
  createCanvas(400, 400);
  noLoop();
}
function draw() {
  background(220);
  fill(200, 50, 50);
  noStroke();
  rect(75, 75, 250, 150);
}

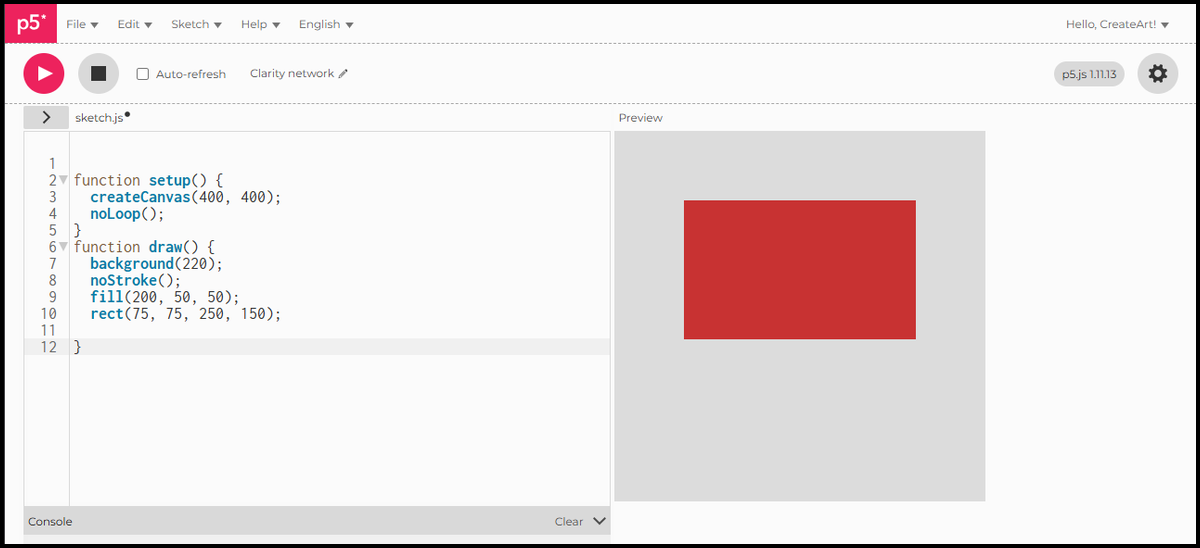
A 250 by 150 rectangle, starting 75 pixels from the left edge and 75 from the top.

A red rectangle on a grey canvas

rectMode(CENTER)

By default, rect() positions from the top-left corner. rectMode(CENTER) changes that: x and y become the centre point, the same way ellipse() works. That makes it easier to position several shapes relative to each other on the canvas. To switch back: rectMode(CORNER).

function setup() {
  createCanvas(400, 400);
  noLoop();
  rectMode(CENTER);
}
function draw() {
  background(220);
  noStroke();

  fill(255, 255, 255);
  rect(200, 100, 250, 75);

  fill(200, 50, 50);
  rect(200, 175, 250, 75);
}

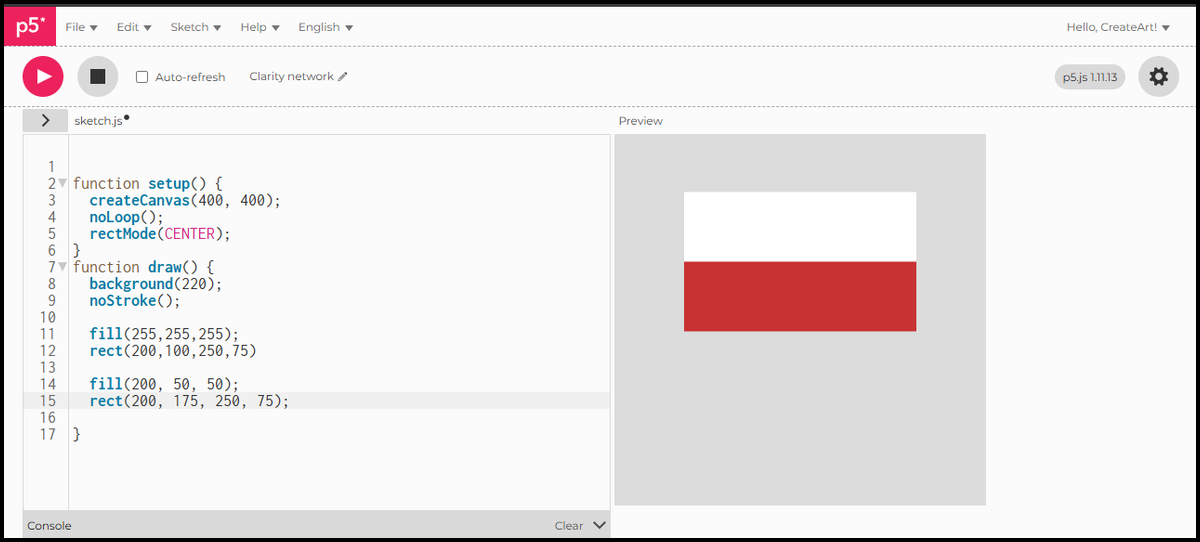
Two rectangles centred on the same vertical axis. White on top, red below. The flag is starting to take shape.

Two rectangles centred on the same axis, white on top and red below

The line() function

line(x1, y1, x2, y2) draws a straight line between two points. A line has no fill, only a stroke. stroke() sets its colour and strokeWeight() sets its thickness.

function setup() {
  createCanvas(400, 400);
  noLoop();
  rectMode(CENTER);
}
function draw() {
  background(220);
  noStroke();

  fill(255, 255, 255);
  rect(200, 100, 250, 75);

  fill(200, 50, 50);
  rect(200, 175, 250, 75);

  stroke(0, 0, 0);
  strokeWeight(10);
  line(75, 60, 75, 350);
}

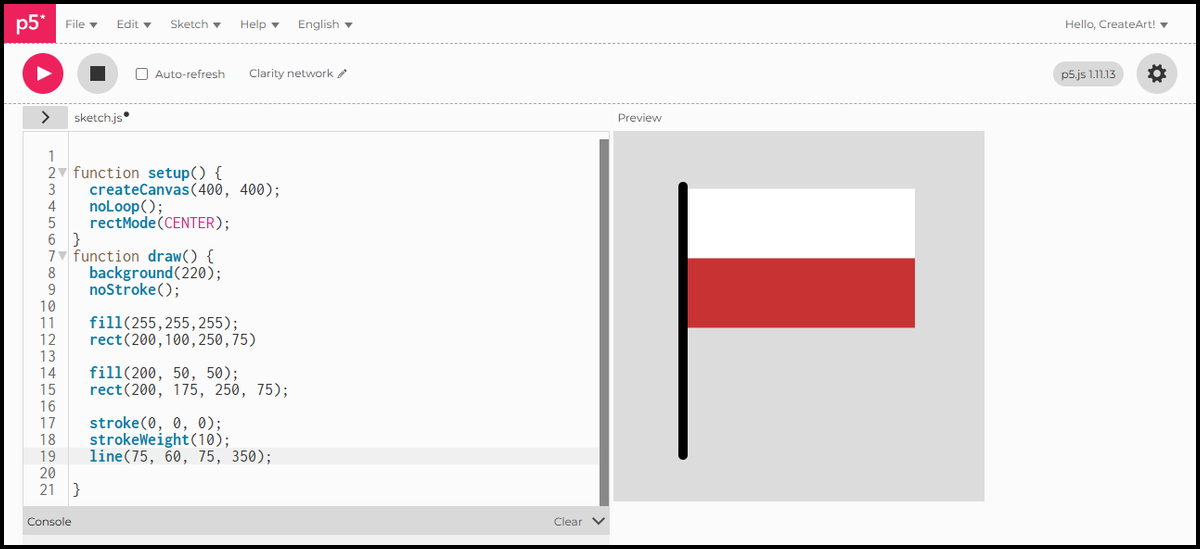
The flagpole is a vertical black line, 10 pixels wide, running along the left edge of the flag.

Two rectangles with a vertical black flagpole on the left edge

The triangle() function

triangle(x1, y1, x2, y2, x3, y3) connects three points. Each pair of numbers is one corner.

function setup() {
  createCanvas(400, 400);
  noLoop();
  rectMode(CENTER);
}
function draw() {
  background(220);
  noStroke();

  fill(255, 255, 255);
  rect(200, 100, 250, 75);

  fill(200, 50, 50);
  rect(200, 175, 250, 75);

  stroke(0, 0, 0);
  strokeWeight(10);
  line(75, 60, 75, 350);

  fill(17, 69, 126);
  noStroke();
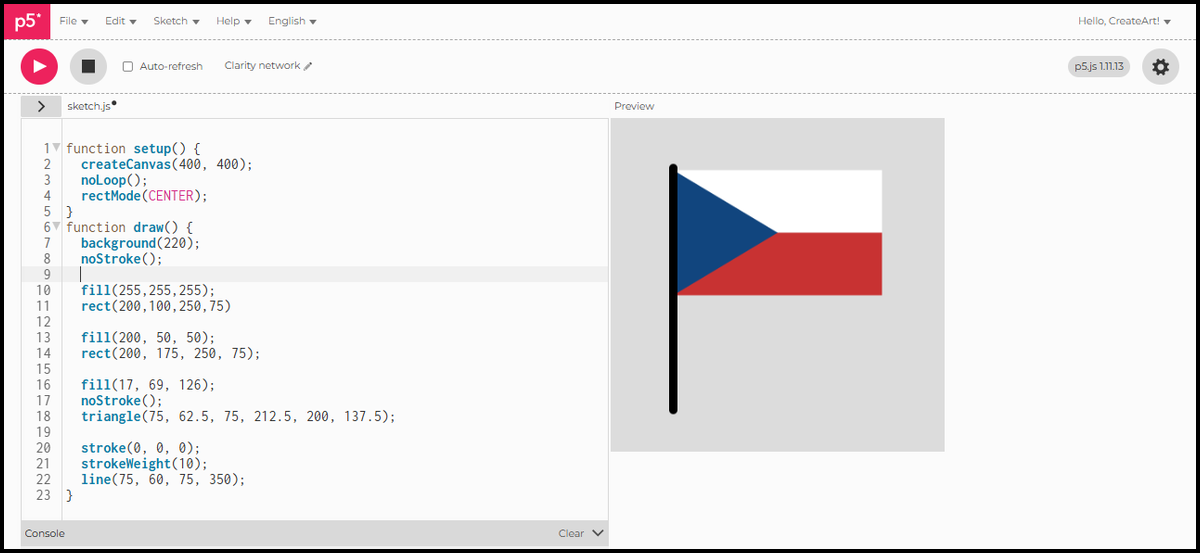
  triangle(75, 62.5, 75, 212.5, 200, 137.5);
}

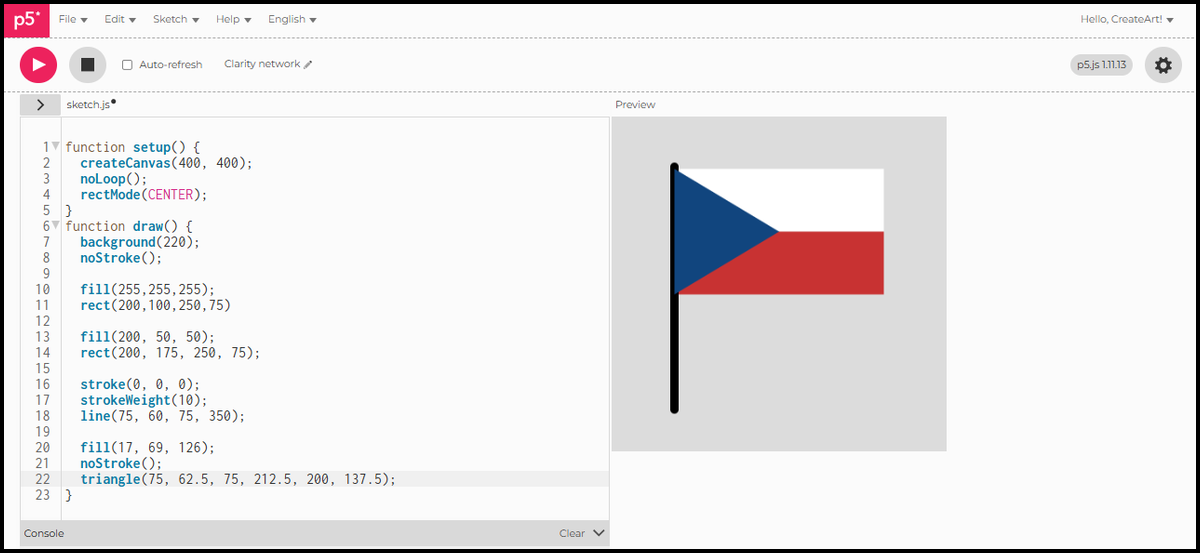
The blue wedge has three corners: top-left at (75, 62.5), bottom-left at (75, 212.5), and the tip pointing right at (200, 137.5). Almost a flag. But the pole has disappeared behind the triangle, because the triangle was drawn after it. p5.js executes draw() in sequence, top to bottom. Whatever is written last appears on top.

The flag with a blue triangle added, the flagpole hidden behind it

Draw order

Moving the line to the end of draw() puts it on top of everything else.

function setup() {
  createCanvas(400, 400);
  noLoop();
  rectMode(CENTER);
}
function draw() {
  background(220);
  noStroke();

  fill(255, 255, 255);
  rect(200, 100, 250, 75);

  fill(200, 50, 50);
  rect(200, 175, 250, 75);

  fill(17, 69, 126);
  noStroke();
  triangle(75, 62.5, 75, 212.5, 200, 137.5);

  stroke(0, 0, 0);
  strokeWeight(10);
  line(75, 60, 75, 350);
}

The pole now sits in front of the flag, exactly where it should be.

The completed Czech flag with the flagpole drawn on top

Czech flag

As scripts grow it gets easy to lose track of what each part does. Comments let you add notes directly in the code. p5.js ignores them when the sketch runs. They are there for you, not the computer. Put // before any text to make it a comment. A comment on its own line is enough to label a whole block.

function setup() {
  createCanvas(400, 400);
  noLoop();
  rectMode(CENTER);
}
function draw() {
  background(220);
  noStroke();

// White top stripe
  fill(255, 255, 255);
  rect(200, 100, 250, 75);

// Red bottom stripe
  fill(200, 50, 50);
  rect(200, 175, 250, 75);

  // Blue triangle
  fill(17, 69, 126);
  noStroke();
  triangle(75, 62.5, 75, 212.5, 200, 137.5);

  // Flagpole
  stroke(0, 0, 0);
  strokeWeight(10);
  line(75, 60, 75, 350);
}

In Session 4 we look at loops: how to repeat a shape across the canvas without writing the same line of code a hundred times.

p5.js Session 2: Your First Sketch

Session 1 set up the editor and introduced the default template. In this session you write something real: a shape, a colour, a canvas that is yours.

Canvas size

You already know the canvas is your piece of paper. Those two numbers inside createCanvas() are its width and height in pixels. Change them and the paper changes size.

function setup() {
  createCanvas(600, 300);
  noLoop();
}

function draw() {
  background(220);
}

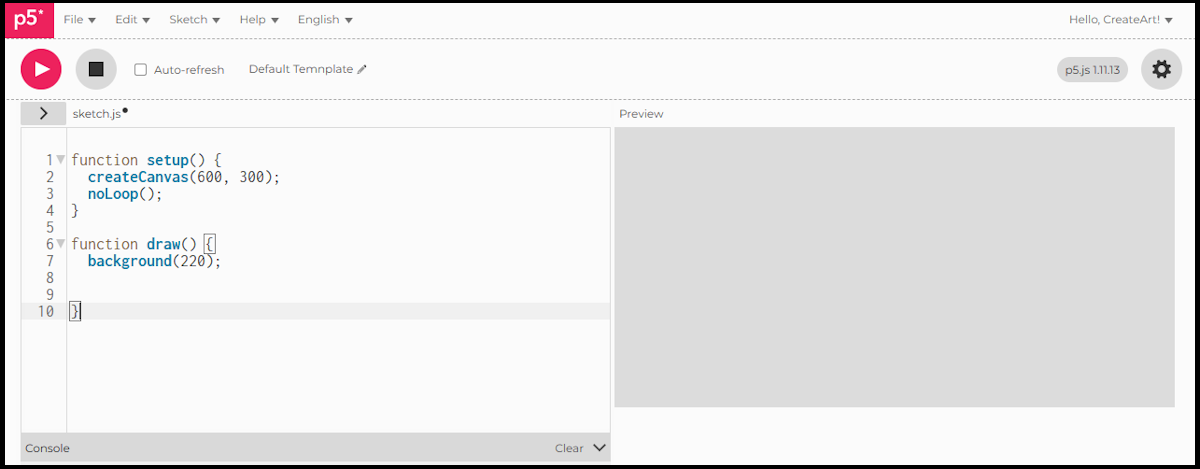
A wider canvas, 600 pixels across and 300 tall. We need to change the default canvas size: the Japan flag we are drawing in this session is wider than it is tall. Let’s use 600 by 300.

The p5.js preview panel showing a 600 by 300 grey canvas

How coordinates work

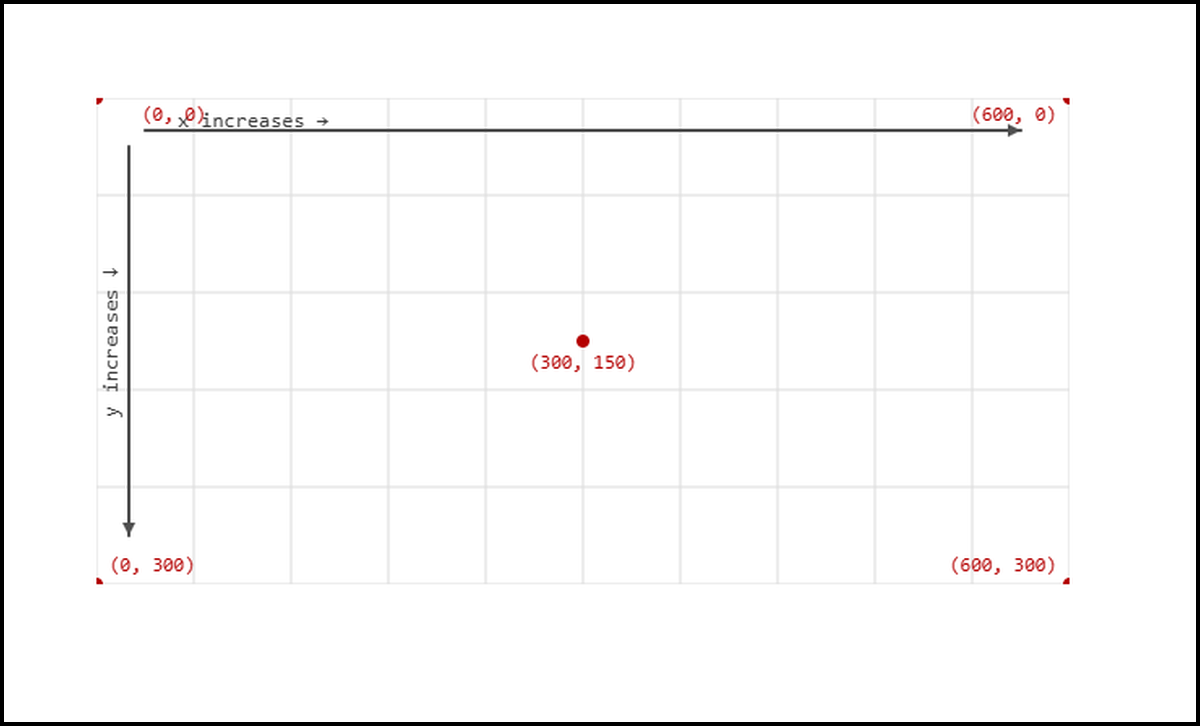
Every point on the canvas has an x position and a y position. x goes left to right. y goes top to bottom. The top left corner is (0, 0).

Think of a grid pinned at the top left of your piece of paper. As you move right, x increases. As you move down, y increases. The centre of a 600 by 300 canvas is (300, 150).

Diagram showing the canvas coordinate system with (0,0) at the top left and axes labeled

Colour: fill and stroke

Before you draw a shape, you tell p5.js what colour to use. fill() sets the colour inside the shape. stroke() sets the colour of the outline. Both take RGB values: three numbers between 0 and 255, one for red, one for green, one for blue.

fill(220, 0, 0);   // red fill
stroke(0);         // black outline

To remove the outline entirely:

noStroke();

These settings stay in effect until you change them. Set the colour before the shape you want to colour.

Your first shape: ellipse

ellipse(x, y, w, h) draws an ellipse. x and y are the centre point. w is the width, h is the height. When width and height are equal, you get a circle.

The Japan flag is a useful shape to aim for: a red circle, centred on a white canvas. It uses everything covered above.

function setup() {
  createCanvas(600, 300);
  noLoop();
}

function draw() {
  background(255);
  fill(220, 0, 0);
  noStroke();
  ellipse(300, 150, 180, 180);
}
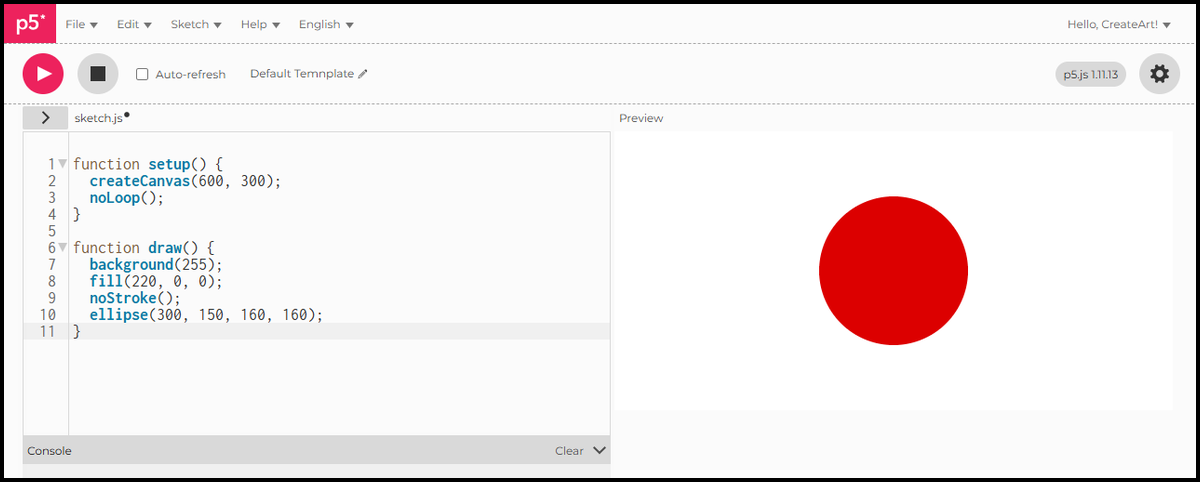
  • background(255) fills the canvas white.
  • fill(220, 0, 0) sets the colour to red before the ellipse is drawn.
  • noStroke() removes the outline.
  • ellipse(300, 150, 180, 180) places a 180 by 180 circle at the centre of the 600 by 300 canvas.

Run it. That is your first real sketch.

The p5.js preview panel showing the finished Japan flag sketch

Saving your sketch

File > Save, or Cmd/Ctrl + S. Give the sketch a name by clicking the pencil icon next to the title at the top. Once saved, it appears in your account under File > Open.


In Session 3 we add more shapes and look at what happens when you combine them on the canvas.

p5.js Session 1: Introduction to p5.js

If you have ever wondered whether you need to be a developer to make generative art, you do not. This series goes through p5.js step by step, a tool built for designers and creatives, not computer scientists. A second series covers more complex territory, and from there the work is yours to take wherever you want.

p5.js is a JavaScript library for creative coding. It was created by Lauren Lee McCarthy in 2013 as a reinterpretation of Processing, the Java-based environment that Ben Fry and Casey Reas built in 2001 to make programming accessible to artists and designers. p5.js brings the same idea to the browser.

You can use p5.js in two ways: through the web editor at editor.p5js.org, or by setting up a local environment on your computer. This series uses the web editor throughout. No installation, no configuration - open the browser and start.

The web editor

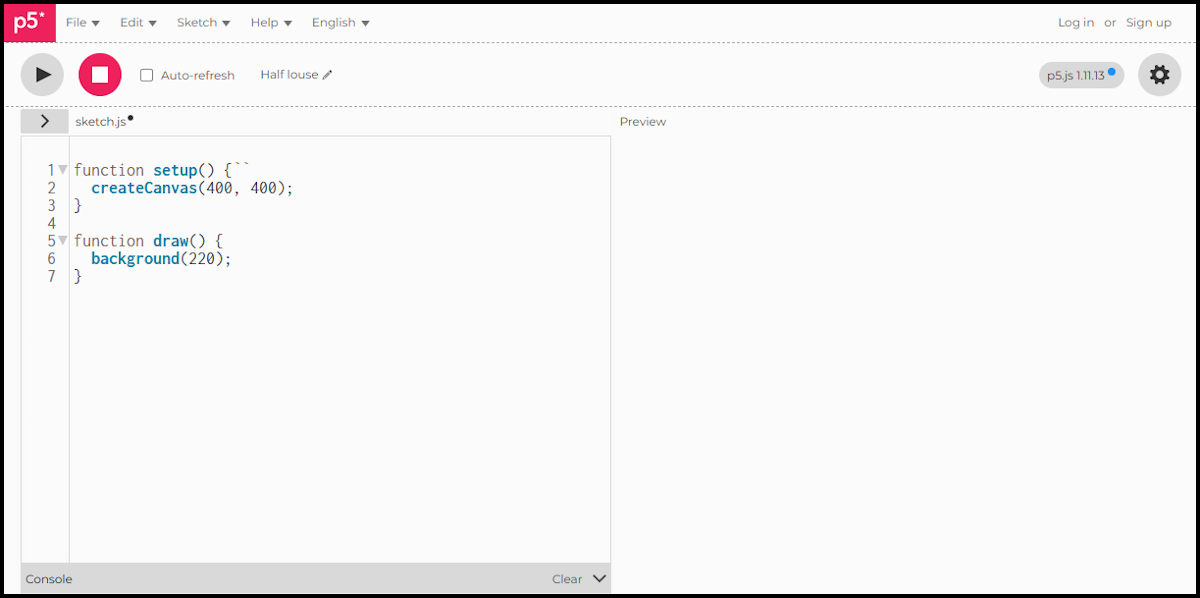
Go to editor.p5js.org. The editor loads with a default sketch already open.

The p5.js web editor showing a new sketch with the default template

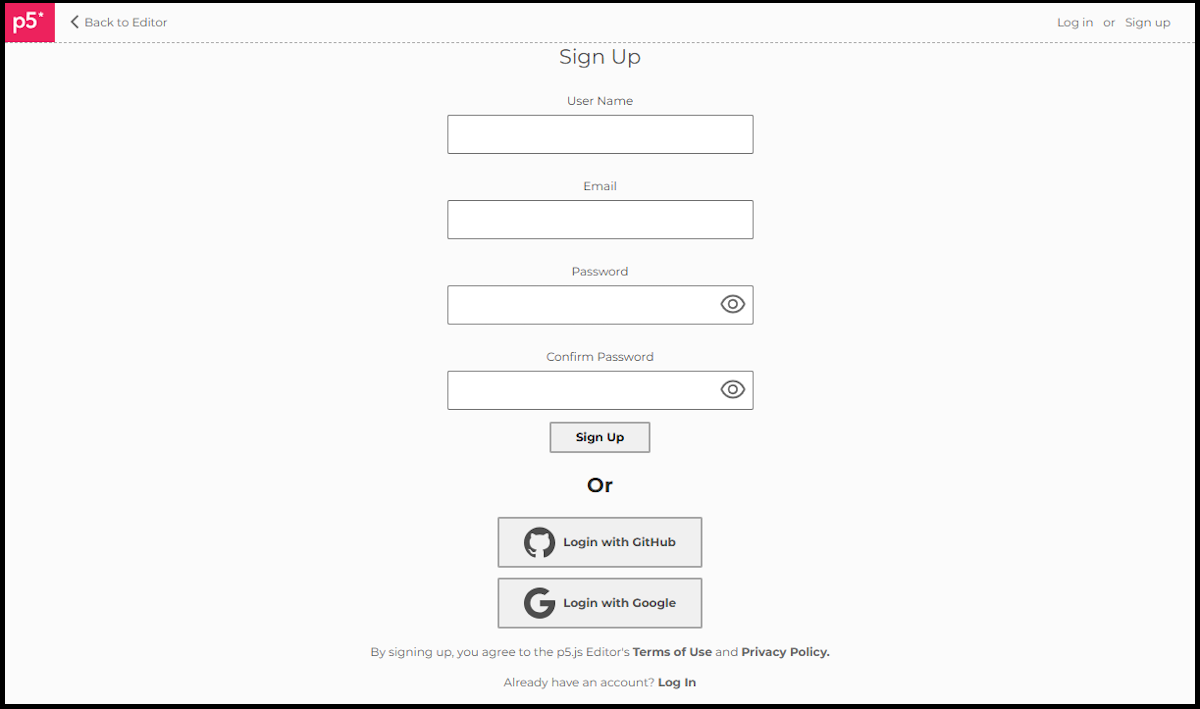
You can run sketches without an account, but you cannot save them. To save your work, click “Sign up” in the top right. You can create a free account with a username and password, or log in directly with GitHub or Google.

The p5.js web editor sign up page

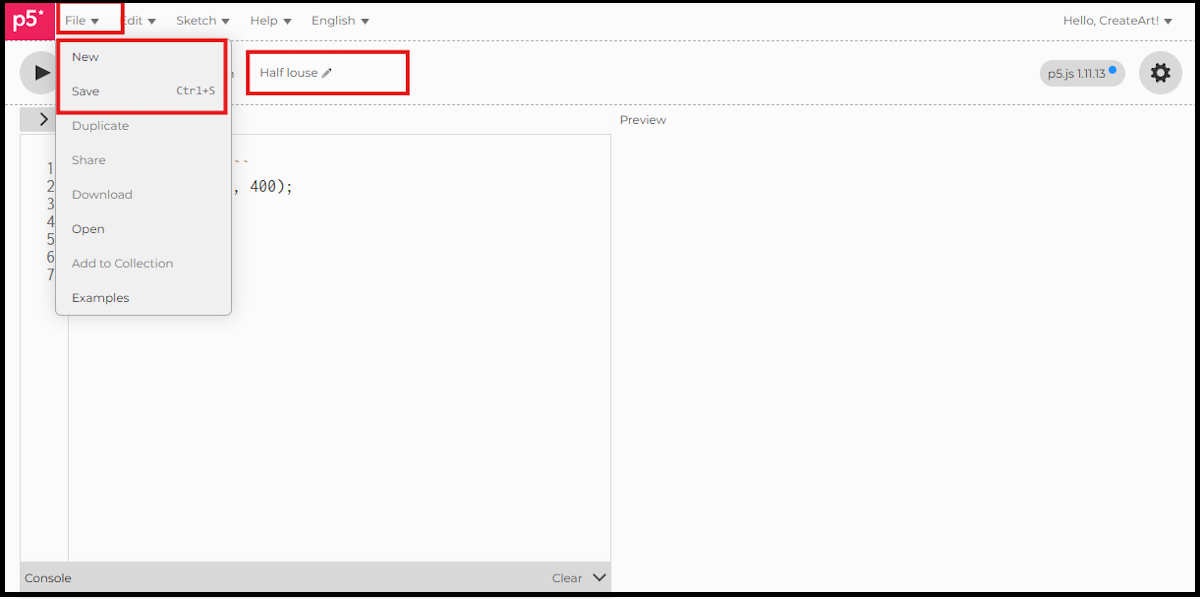
Once you have an account, use File > Save (or Cmd/Ctrl + S) to save. Each saved sketch gets a name - you can rename it by clicking the pencil icon next to the sketch name at the top.

To start a fresh sketch, go to File > New. The File menu is also where you save your work, duplicate an existing sketch, or download it to your computer.

The p5.js web editor File menu with New highlighted

The default template

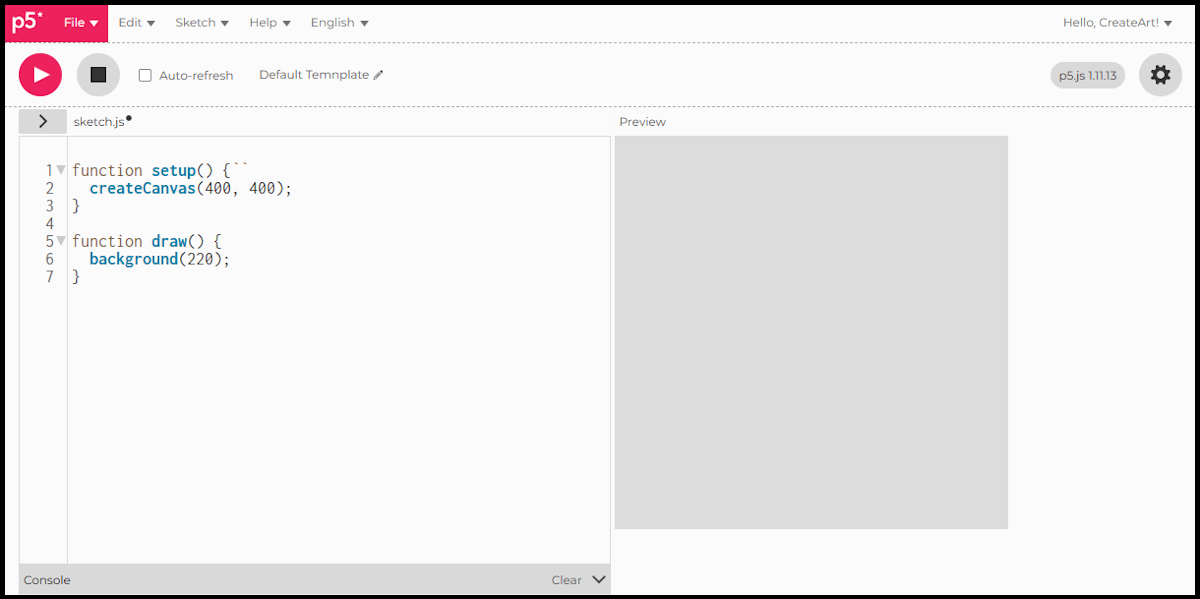
Every new sketch opens with this code:

function setup() {
  createCanvas(400, 400);
}

function draw() {
  background(220);
}

Think of it like sitting down to draw. Before anything else, you reach for a piece of paper. That is what createCanvas(400, 400) does: it puts a 400 by 400 pixel canvas in front of you. setup() is where that happens. It runs once when the sketch starts, and it is where you get everything ready before the drawing begins.

draw() is the drawing itself. It runs on a loop after setup, 60 times per second by default. Right now the only thing in it is background(220), which paints the whole canvas grey. The number is a greyscale value: 0 is black, 255 is white, 220 is a light grey.

Press play and you will see exactly that: a plain grey square, your blank page, ready.

The p5.js web editor showing the preview panel with a grey square canvas

The noLoop() function

Because draw() loops by default, the sketch keeps running even when nothing is changing. For a static generative art you usually want the sketch to run once and stop. Add noLoop() inside setup():

function setup() {
  createCanvas(400, 400);
  noLoop();
}

Every sketch in this series uses noLoop() unless the post is specifically about animation.

You could also put all your drawing code inside setup() and skip draw() entirely for static work, since setup is executed only once. I prefer not to. I keep setup() for configuration and draw() for the artwork, whether it moves or not. That consistency makes it easier to read your own code later, and noLoop() costs nothing.

Variables

A variable is a container. It holds a piece of information so you can use it later, or use it in multiple places. Think of it like storing your name or your age: the label stays the same, the value inside it can change.

For drawing, variables are how you store things you want to reuse. The diameter of a circle, the position of a shape on the canvas, a colour value. Instead of typing 400 in five different places, you store it once:

let canvasSize = 400;

Now you can use canvasSize anywhere in the sketch. Change the number once and it updates everywhere.

Data types

p5.js uses the same basic types as JavaScript. Three are enough for now. Numbers are any numeric value: 400, 3.14, 0. Strings are text wrapped in quotes: "hello", "red". Booleans are true or false, used for on/off decisions. You do not need to declare the type when you create a variable - JavaScript works it out from the value you assign.


That is the foundation. In Session 2 we write the first real sketch from scratch: a shape, a colour, and a canvas that is yours.