All posts

shapes

2 posts

p5.js Session 3: More Shapes

The Japan flag needed just one shape. This session we draw another flag, and for that we will add three more shapes to your toolkit.

The rect() function

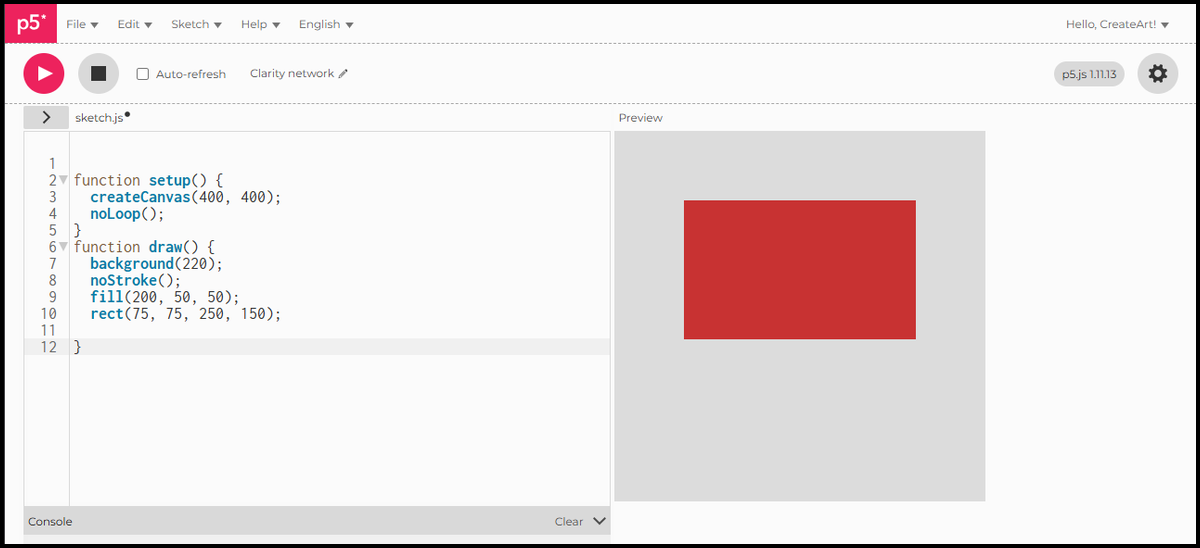
rect(x, y, width, height) draws a rectangle. By default, x and y are the top-left corner. Width and height set how far it stretches from there.

function setup() {
  createCanvas(400, 400);
  noLoop();
}
function draw() {
  background(220);
  fill(200, 50, 50);
  noStroke();
  rect(75, 75, 250, 150);
}

A 250 by 150 rectangle, starting 75 pixels from the left edge and 75 from the top.

A red rectangle on a grey canvas

rectMode(CENTER)

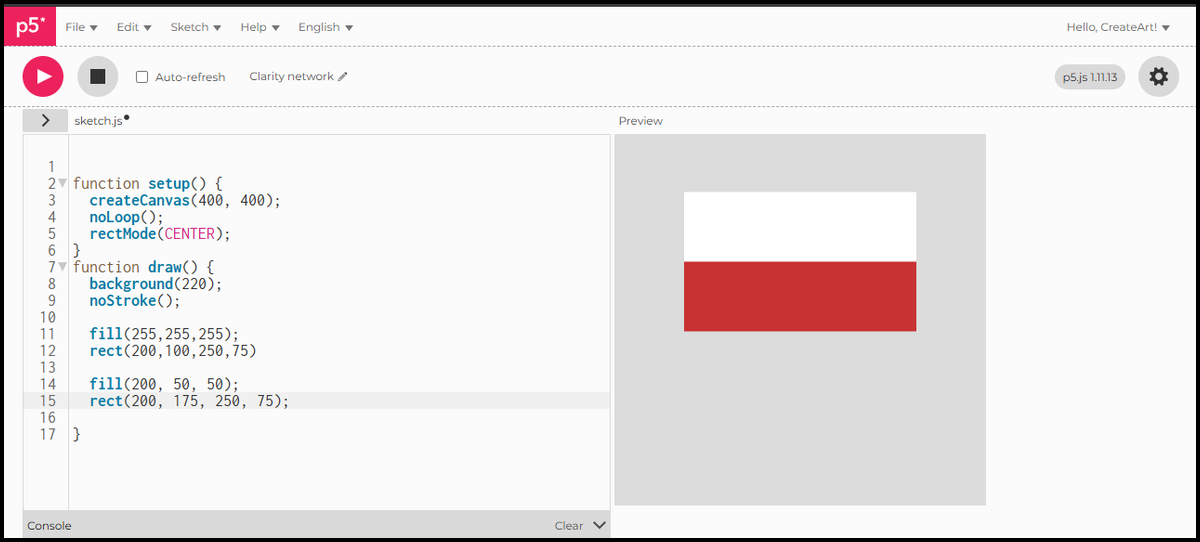
By default, rect() positions from the top-left corner. rectMode(CENTER) changes that: x and y become the centre point, the same way ellipse() works. That makes it easier to position several shapes relative to each other on the canvas. To switch back: rectMode(CORNER).

function setup() {
  createCanvas(400, 400);
  noLoop();
  rectMode(CENTER);
}
function draw() {
  background(220);
  noStroke();

  fill(255, 255, 255);
  rect(200, 100, 250, 75);

  fill(200, 50, 50);
  rect(200, 175, 250, 75);
}

Two rectangles centred on the same vertical axis. White on top, red below. The flag is starting to take shape.

Two rectangles centred on the same axis, white on top and red below

The line() function

line(x1, y1, x2, y2) draws a straight line between two points. A line has no fill, only a stroke. stroke() sets its colour and strokeWeight() sets its thickness.

function setup() {
  createCanvas(400, 400);
  noLoop();
  rectMode(CENTER);
}
function draw() {
  background(220);
  noStroke();

  fill(255, 255, 255);
  rect(200, 100, 250, 75);

  fill(200, 50, 50);
  rect(200, 175, 250, 75);

  stroke(0, 0, 0);
  strokeWeight(10);
  line(75, 60, 75, 350);
}

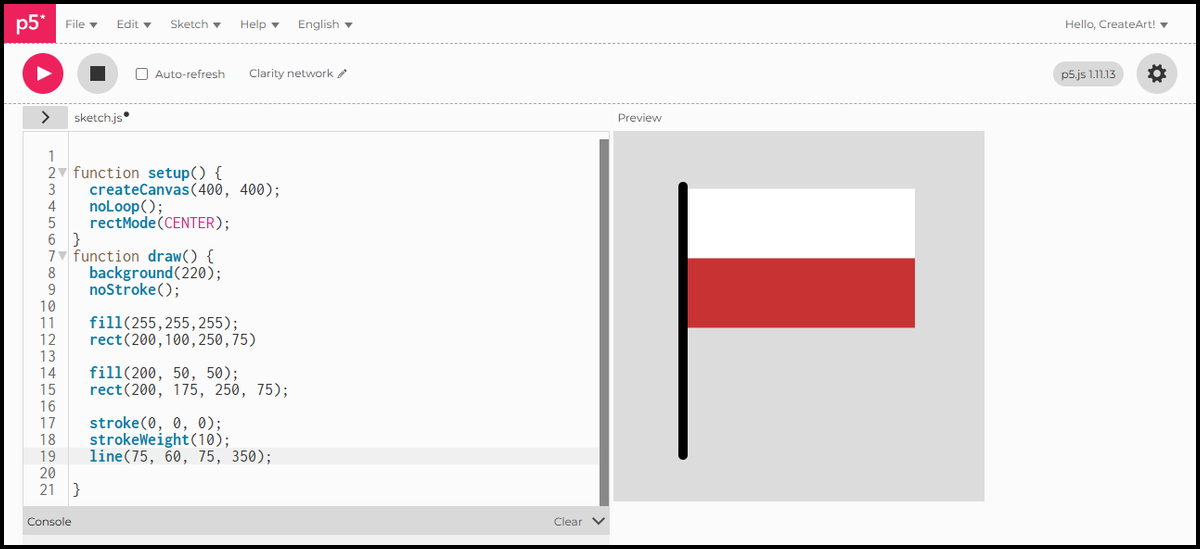
The flagpole is a vertical black line, 10 pixels wide, running along the left edge of the flag.

Two rectangles with a vertical black flagpole on the left edge

The triangle() function

triangle(x1, y1, x2, y2, x3, y3) connects three points. Each pair of numbers is one corner.

function setup() {
  createCanvas(400, 400);
  noLoop();
  rectMode(CENTER);
}
function draw() {
  background(220);
  noStroke();

  fill(255, 255, 255);
  rect(200, 100, 250, 75);

  fill(200, 50, 50);
  rect(200, 175, 250, 75);

  stroke(0, 0, 0);
  strokeWeight(10);
  line(75, 60, 75, 350);

  fill(17, 69, 126);
  noStroke();
  triangle(75, 62.5, 75, 212.5, 200, 137.5);
}

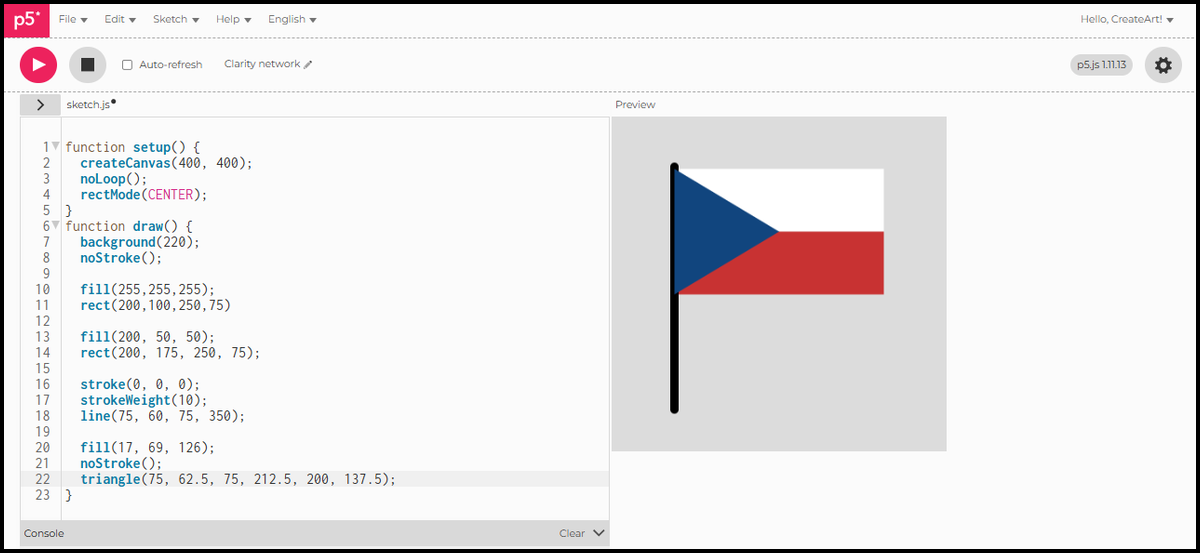
The blue wedge has three corners: top-left at (75, 62.5), bottom-left at (75, 212.5), and the tip pointing right at (200, 137.5). Almost a flag. But the pole has disappeared behind the triangle, because the triangle was drawn after it. p5.js executes draw() in sequence, top to bottom. Whatever is written last appears on top.

The flag with a blue triangle added, the flagpole hidden behind it

Draw order

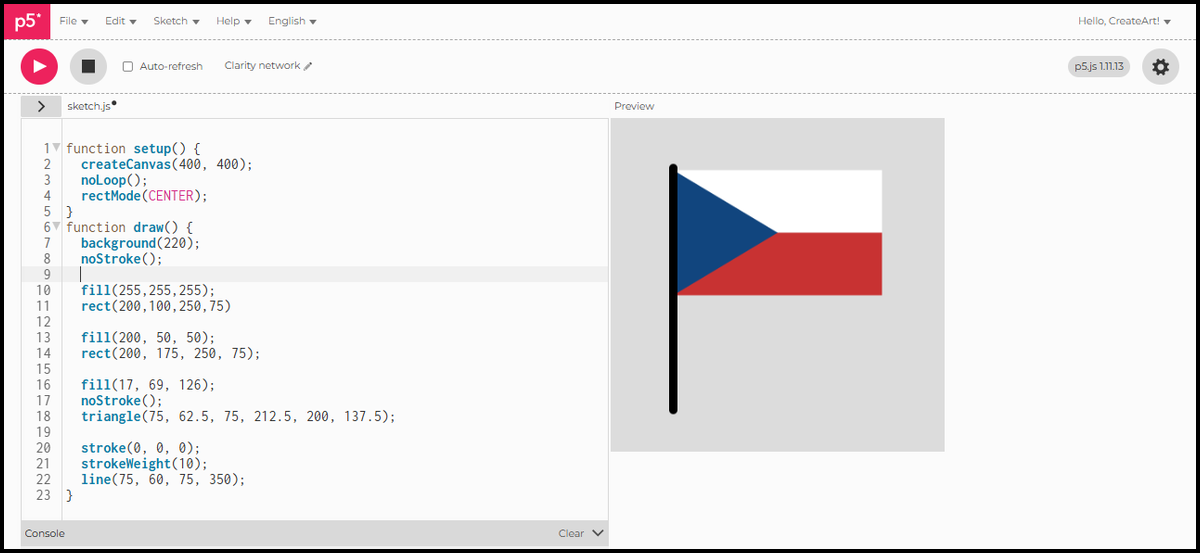
Moving the line to the end of draw() puts it on top of everything else.

function setup() {
  createCanvas(400, 400);
  noLoop();
  rectMode(CENTER);
}
function draw() {
  background(220);
  noStroke();

  fill(255, 255, 255);
  rect(200, 100, 250, 75);

  fill(200, 50, 50);
  rect(200, 175, 250, 75);

  fill(17, 69, 126);
  noStroke();
  triangle(75, 62.5, 75, 212.5, 200, 137.5);

  stroke(0, 0, 0);
  strokeWeight(10);
  line(75, 60, 75, 350);
}

The pole now sits in front of the flag, exactly where it should be.

The completed Czech flag with the flagpole drawn on top

Czech flag

As scripts grow it gets easy to lose track of what each part does. Comments let you add notes directly in the code. p5.js ignores them when the sketch runs. They are there for you, not the computer. Put // before any text to make it a comment. A comment on its own line is enough to label a whole block.

function setup() {
  createCanvas(400, 400);
  noLoop();
  rectMode(CENTER);
}
function draw() {
  background(220);
  noStroke();

// White top stripe
  fill(255, 255, 255);
  rect(200, 100, 250, 75);

// Red bottom stripe
  fill(200, 50, 50);
  rect(200, 175, 250, 75);

  // Blue triangle
  fill(17, 69, 126);
  noStroke();
  triangle(75, 62.5, 75, 212.5, 200, 137.5);

  // Flagpole
  stroke(0, 0, 0);
  strokeWeight(10);
  line(75, 60, 75, 350);
}

In Session 4 we look at loops: how to repeat a shape across the canvas without writing the same line of code a hundred times.

p5.js Session 2: Your First Sketch

Session 1 set up the editor and introduced the default template. In this session you write something real: a shape, a colour, a canvas that is yours.

Canvas size

You already know the canvas is your piece of paper. Those two numbers inside createCanvas() are its width and height in pixels. Change them and the paper changes size.

function setup() {
  createCanvas(600, 300);
  noLoop();
}

function draw() {
  background(220);
}

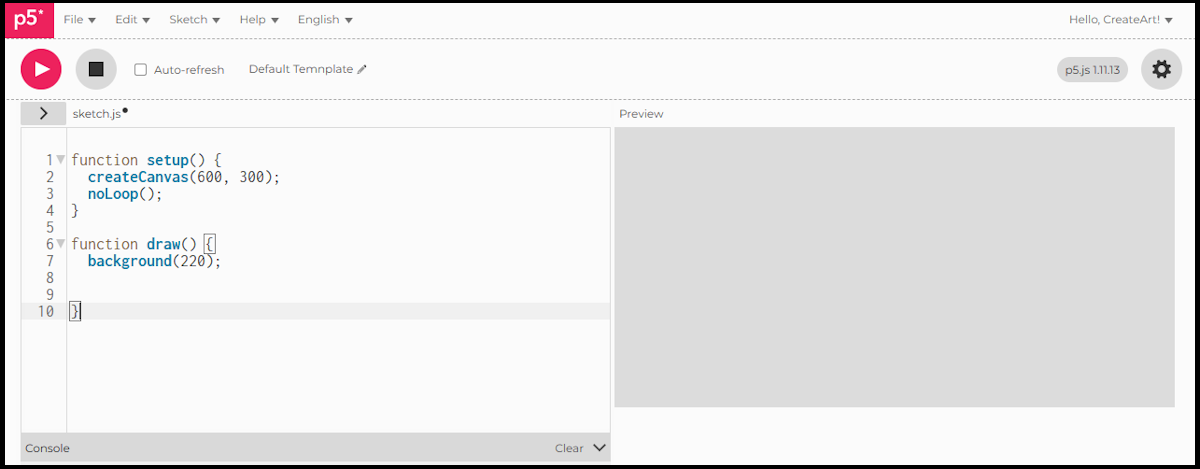
A wider canvas, 600 pixels across and 300 tall. We need to change the default canvas size: the Japan flag we are drawing in this session is wider than it is tall. Let’s use 600 by 300.

The p5.js preview panel showing a 600 by 300 grey canvas

How coordinates work

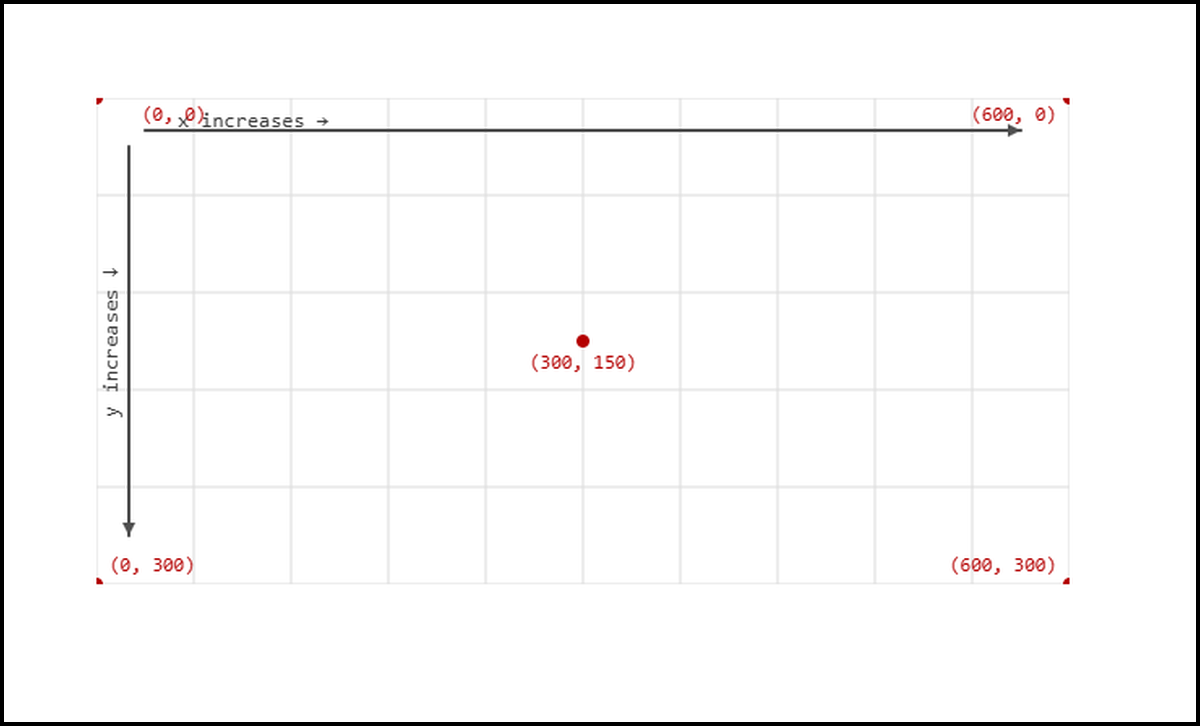
Every point on the canvas has an x position and a y position. x goes left to right. y goes top to bottom. The top left corner is (0, 0).

Think of a grid pinned at the top left of your piece of paper. As you move right, x increases. As you move down, y increases. The centre of a 600 by 300 canvas is (300, 150).

Diagram showing the canvas coordinate system with (0,0) at the top left and axes labeled

Colour: fill and stroke

Before you draw a shape, you tell p5.js what colour to use. fill() sets the colour inside the shape. stroke() sets the colour of the outline. Both take RGB values: three numbers between 0 and 255, one for red, one for green, one for blue.

fill(220, 0, 0);   // red fill
stroke(0);         // black outline

To remove the outline entirely:

noStroke();

These settings stay in effect until you change them. Set the colour before the shape you want to colour.

Your first shape: ellipse

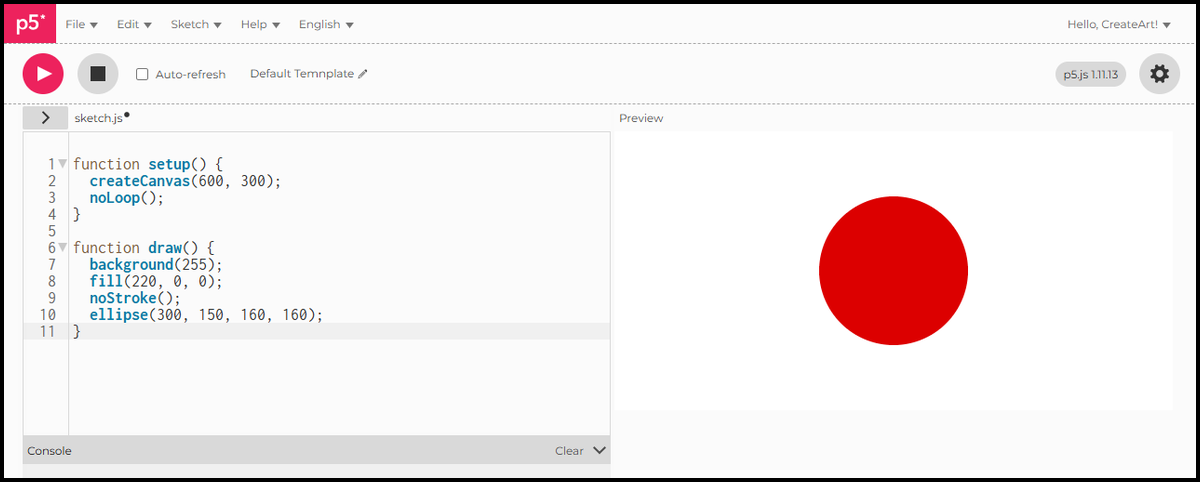
ellipse(x, y, w, h) draws an ellipse. x and y are the centre point. w is the width, h is the height. When width and height are equal, you get a circle.

The Japan flag is a useful shape to aim for: a red circle, centred on a white canvas. It uses everything covered above.

function setup() {
  createCanvas(600, 300);
  noLoop();
}

function draw() {
  background(255);
  fill(220, 0, 0);
  noStroke();
  ellipse(300, 150, 180, 180);
}
  • background(255) fills the canvas white.
  • fill(220, 0, 0) sets the colour to red before the ellipse is drawn.
  • noStroke() removes the outline.
  • ellipse(300, 150, 180, 180) places a 180 by 180 circle at the centre of the 600 by 300 canvas.

Run it. That is your first real sketch.

The p5.js preview panel showing the finished Japan flag sketch

Saving your sketch

File > Save, or Cmd/Ctrl + S. Give the sketch a name by clicking the pencil icon next to the title at the top. Once saved, it appears in your account under File > Open.


In Session 3 we add more shapes and look at what happens when you combine them on the canvas.